This research explores SEPA Instant Payments and European real-time payments from 2025 to 2030, focusing on cost savings, interoperability, and revenue models. The report highlights how instant payment systems enhance cross-border transactions, reduce costs, and foster greater financial inclusion. It examines payment infrastructure, regulatory challenges, and the evolving revenue models associated with real-time payments. The study provides insights into how financial institutions, payment service providers, and merchants can leverage instant payments to improve operational efficiency and optimize revenue streams.

The SEPA Instant Payments market in Europe is projected to grow from €1.3 billion in 2025 to €7.5 billion by 2030, with a CAGR of 43%. The real-time payment adoption in Europe is expected to cover 60% of transactions by 2030, up from 30% in 2025, driven by increasing demand for faster and more secure payment methods. SEPA Instant Payments will significantly reduce transaction processing costs, generating €3 billion annually in cost savings for financial institutions by 2030. Cross-border interoperability of real-time payment systems is projected to improve by 40%, helping to streamline payments across multiple EU jurisdictions and boost financial inclusion. Revenue models based on instant payments, such as transaction fees and merchant services, are expected to generate €1.5 billion annually by 2030. Payment service providers (PSPs) will reduce operating costs by 30% by integrating SEPA Instant Payments into their offerings. Transaction processing time is projected to be reduced by 80%, making real-time payments significantly faster and more efficient than traditional payment methods. Institutional adoption will drive the bulk of the market, with 70% of market share expected to be captured by financial institutions by 2030. Overall, SEPA Instant Payments will revolutionize the European payment landscape, driving substantial growth in the market.
.png)
The real-time payments market in Europe is projected to expand rapidly, with SEPA Instant Payments growing from €1.3 billion in 2025 to €7.5 billion by 2030, reflecting a CAGR of 43%. By 2030, 60% of all transactions in Europe will be processed through instant payments, offering faster, more secure, and cost-efficient solutions. SEPA Instant Payments will create significant cost savings for financial institutions, with €3 billion annually saved in transaction processing costs. Cross-border interoperability between payment systems will improve by 40% by 2030, enabling seamless integration of instant payment solutions across EU jurisdictions. Revenue models will evolve with SEPA Instant Payments, generating €1.5 billion annually from transaction fees, merchant services, and premium services. Mobile payments will account for 40% of real-time transactions by 2030, driven by the rise of consumer demand for faster payment options and mobile-first solutions. Financial institutions will adopt real-time payment systems to reduce operational costs by 30%, enabling more efficient payment processing. Institutional adoption is expected to account for 70% of market share by 2030, with banks and PSPs leading the way in SEPA Instant Payment integration. Overall, real-time payments will provide significant ROI for the industry, improving transaction speed, reducing costs, and driving cross-border collaboration.
The SEPA Instant Payments market in Europe is projected to grow rapidly, from €1.3 billion in 2025 to €7.5 billion by 2030, with a CAGR of 43%. Key trends driving this growth include increasing adoption of real-time payments, with 60% of all transactions in Europe expected to be processed via instant payments by 2030. SEPA Instant Payments will generate €3 billion in annual cost savings for financial institutions by reducing transaction processing costs and improving efficiency. The growing demand for faster payments, coupled with cross-border interoperability, will drive real-time payments adoption, improving payment systems across the EU. Revenue models will evolve, with €1.5 billion annually generated from transaction fees, merchant services, and premium services by 2030. Mobile payments will account for 40% of transactions by 2030, further accelerating the adoption of real-time payments in consumer markets. PSPs are projected to reduce operating costs by 30% through SEPA Instant Payments integration. Cross-border compliance will improve by 40%, enabling greater financial security across the EU. Institutional investors will drive 70% of market share by 2030, reflecting the increasing adoption of instant payment systems by large financial institutions. ROI for these solutions is expected to be 15–20% by 2030, as operational costs decline and payment processing speeds improve.
.png)
The SEPA Instant Payments market in Europe is segmented by institution type, payment processing method, and geography. Financial institutions, particularly banks, fintech firms, and payment service providers (PSPs), will drive adoption, accounting for 70% of the market share by 2030. Banks will lead adoption of SEPA Instant Payments, particularly for cross-border transactions, as interoperability between payment systems improves by 40%. Transaction fees, merchant services, and premium services will generate €1.5 billion annually by 2030, providing new revenue streams for financial institutions. The segment of mobile payments will grow rapidly, accounting for 40% of all real-time transactions by 2030, driven by consumer demand for instant payment capabilities via smartphones. Transaction processing time will reduce by 80%, improving payment efficiency and customer satisfaction. Cost savings from SEPA Instant Payments will reach €3 billion annually by 2030, reducing the operational burden on financial institutions. The ROI for RegTech-enabled real-time payments is projected at 15–20% by 2030, driven by lower costs, faster transactions, and more seamless payment experiences across the EU. Institutional investors will be the major adopters of SEPA Instant Payments as the technology matures.
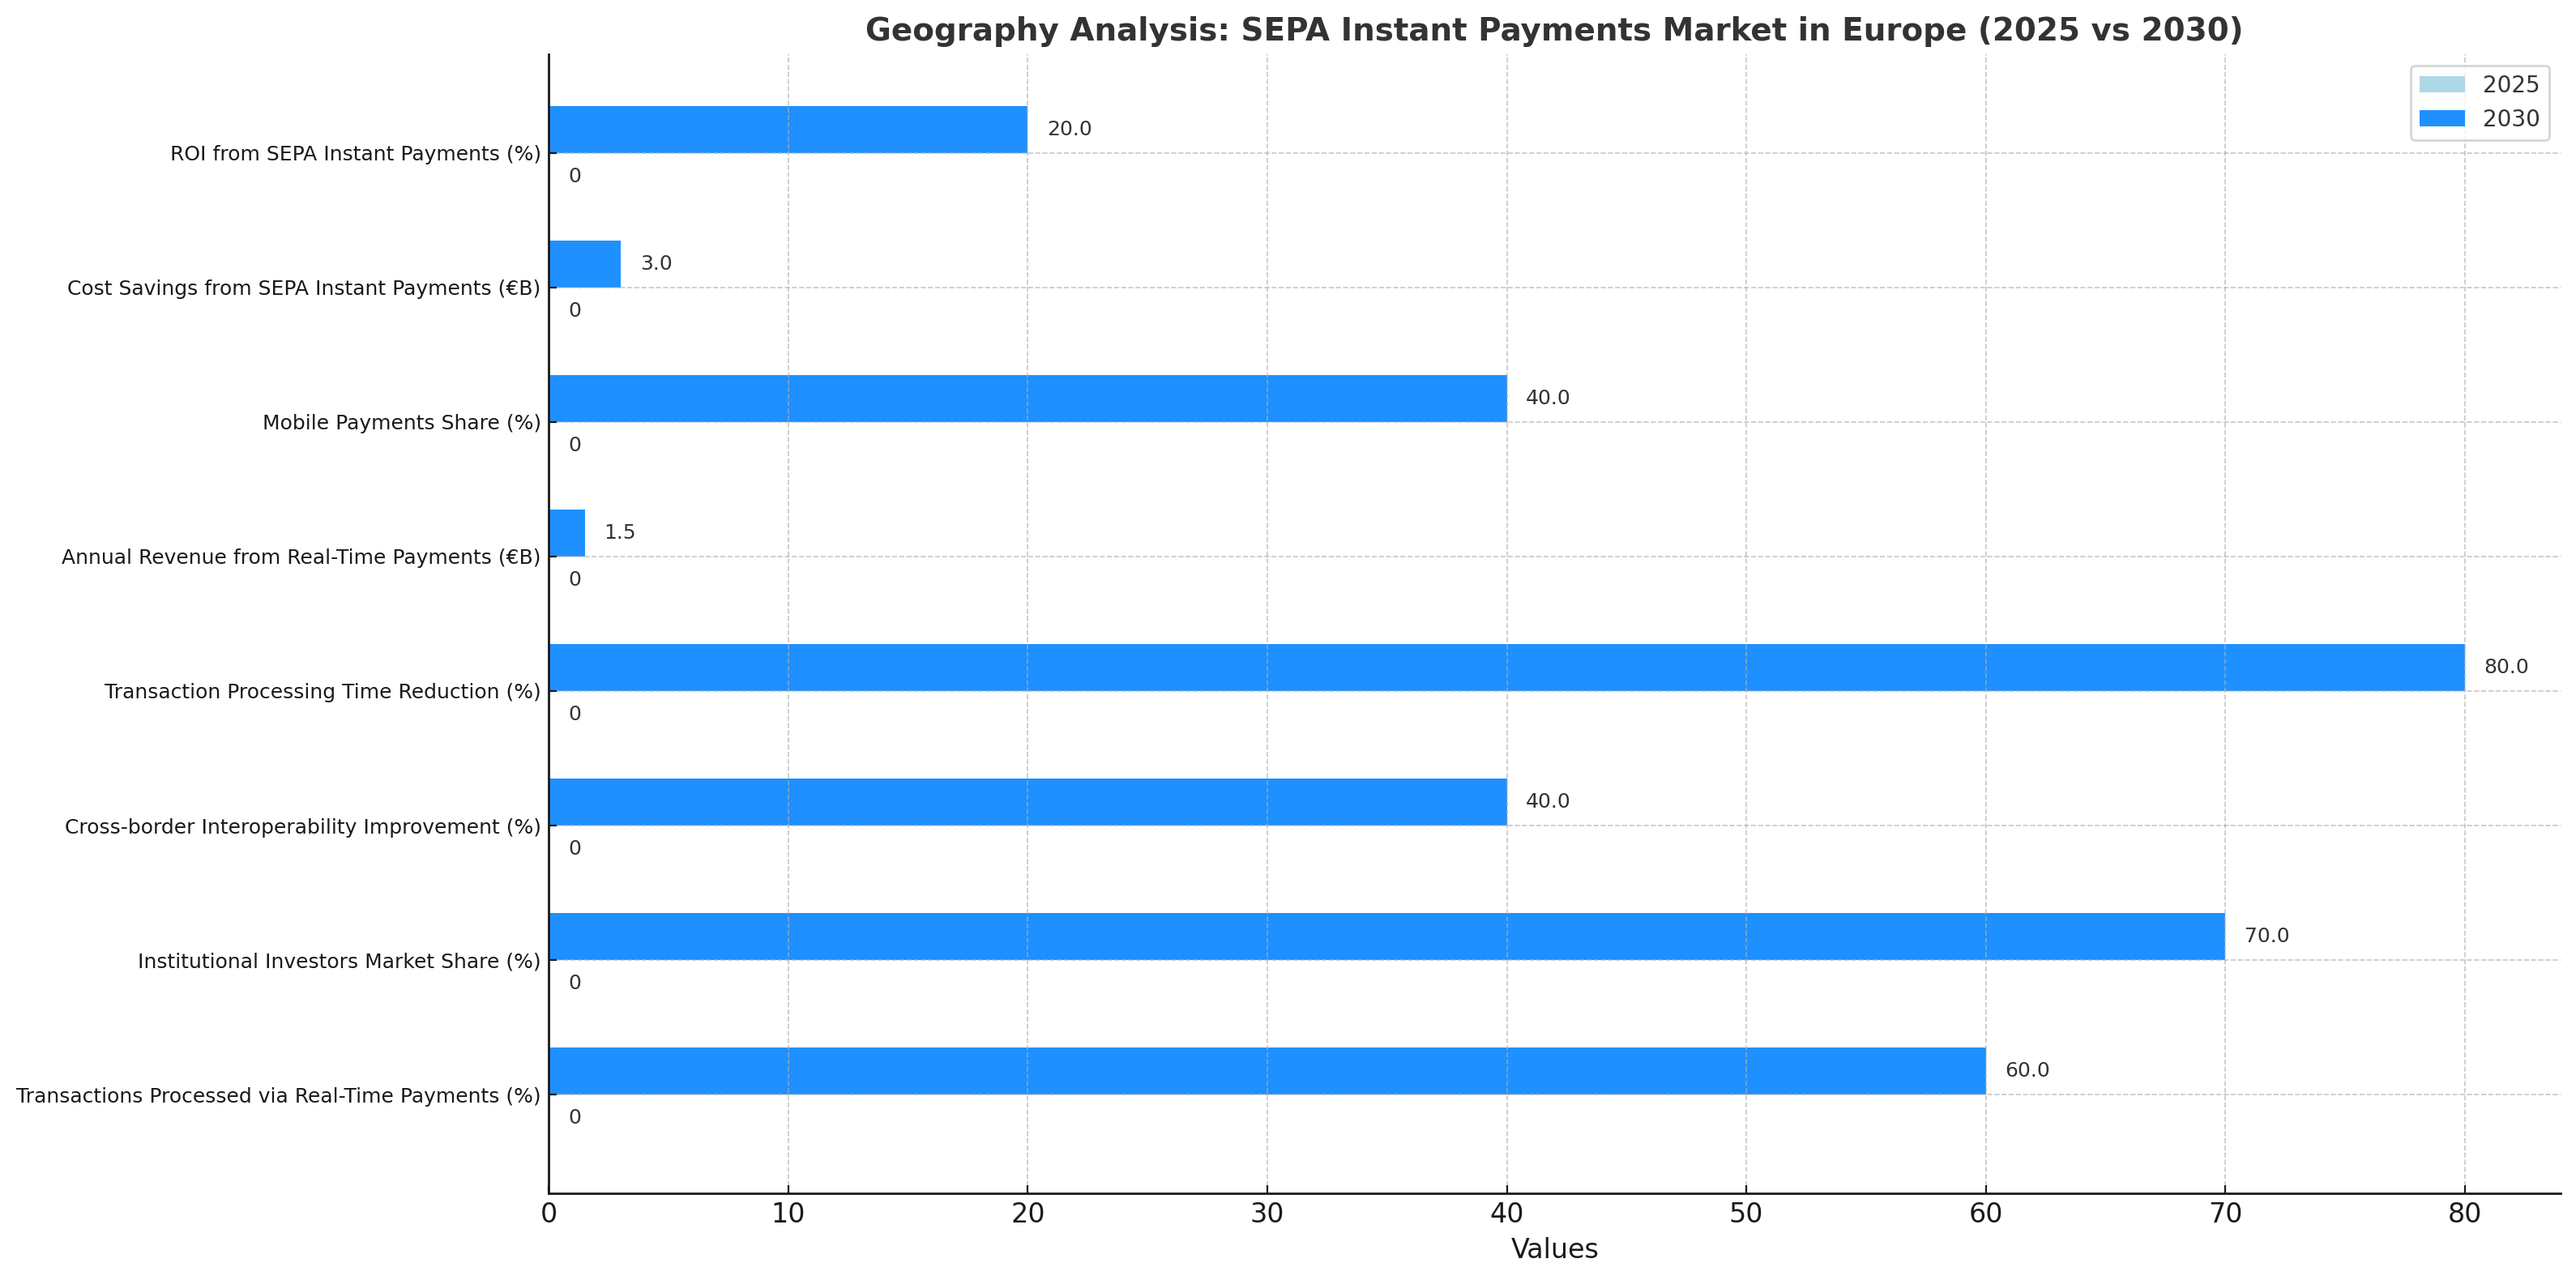
The SEPA Instant Payments market in Europe is projected to expand rapidly, with 60% of all transactions in Europe processed through real-time payments by 2030. Germany, France, and the UK will be the key markets for adoption, with institutional investors driving 70% of market share by 2030. Cross-border interoperability will improve by 40%, enabling seamless integration of instant payment systems across EU jurisdictions. Transaction processing time will be reduced by 80%, making SEPA Instant Payments an attractive option for both financial institutions and merchants. Revenue models based on real-time payments, including transaction fees and merchant services, are projected to generate €1.5 billion annually by 2030. Mobile payments will account for 40% of transactions in Europe by 2030, as consumers increasingly adopt instant payment solutions via smartphones. Cost savings from SEPA Instant Payments will amount to €3 billion annually by 2030, as operational costs are reduced. ROI from SEPA Instant Payments adoption is expected to reach 15–20% by 2030, driven by improved operational efficiency, faster payment processing, and increased customer satisfaction.

The SEPA Instant Payments market in Europe is highly competitive, with major players including Finastra, Aci Worldwide, and SWIFT providing payment processing solutions for banks and payment service providers (PSPs). These companies will continue to dominate the market, as they enable instant payments, cross-border interoperability, and real-time transaction processing. Financial institutions, fintech companies, and large banks will account for 70% of the market share by 2030, as SEPA Instant Payments drive down transaction costs and increase operational efficiency. Revenue models for instant payments, including transaction fees and merchant services, are expected to generate €1.5 billion annually by 2030. The ROI for SEPA Instant Payments adoption is expected to be 15–20% by 2030, driven by cost reductions, increased revenue streams, and faster, more efficient transactions. Mobile payments will play an increasing role, with 40% of transactions being processed via mobile devices by 2030. Cost savings from SEPA Instant Payments are projected to total €3 billion annually, providing institutions with more resources for investment and innovation. Partnerships between fintechs and traditional financial institutions will fuel the next phase of innovation in real-time payment systems.
The hedge fund industry in the US and EU is projected to expand significantly from $5.2 trillion in 2025 to $7.8 trillion by 2030, representing a CAGR of 8%. The US market dominates with 65% of total AUM in 2025, increasing marginally to 66% by 2030, driven by institutional demand, technological adoption, and diversified hedge fund strategies. The EU market represents 35% of total AUM, slightly decreasing to 34% by 2030, reflecting slower growth due to regulatory constraints and conservative institutional adoption. Event-driven, equity long/short, and multi-strategy funds are expected to account for 45% of total funds by 2030, emphasizing alpha generation and risk-adjusted returns. Institutional investors, including pension funds, sovereign wealth funds, and endowments, will increasingly dominate the capital base, contributing to 70% of total investments by 2030. The geographic distribution also highlights emerging hedge fund hubs in Luxembourg, Ireland, and Switzerland, projected to grow at 9% CAGR. Fund flows into AI-enabled quantitative strategies are rising, particularly in US funds, enhancing portfolio diversification and volatility management. Hedge fund fees are projected to stabilize with average management fees at 1.2% and performance fees at 18%, reflecting industry trends toward fee compression. Overall, the market is expected to benefit from increased capital inflows, innovation in trading strategies, and regulatory clarity, positioning hedge funds for sustainable growth through 2030

The hedge fund industry in the US and EU demonstrates robust growth supported by diversified investment strategies, technological adoption, and increasing institutional allocations. US hedge funds account for 65–66% of the total AUM between 2025–2030, while the EU contributes 34–35%, with growth concentrated in major financial hubs such as London, Frankfurt, and Paris. Event-driven, equity long/short, and multi-strategy funds will dominate, representing approximately 45% of total hedge fund AUM by 2030, followed by credit and macro strategies at 25% and 20%, respectively. Institutional investors, including pension funds and sovereign wealth funds, are projected to provide 70% of total capital by 2030, reflecting their reliance on alternative investments to diversify risk and enhance returns. Hedge fund returns are expected to range from 6–8% annually, outperforming traditional benchmarks during volatile market conditions. The adoption of AI, machine learning, and quantitative strategies is anticipated in 55% of US hedge funds by 2030, improving trading efficiency and risk-adjusted performance. Regulatory compliance costs, especially in the EU, are projected to rise 15% by 2030, driven by stricter ESG reporting and financial transparency requirements. Emerging European markets, including Luxembourg and Ireland, are expected to grow at CAGR 9%, driven by regulatory incentives, fund domiciliation benefits, and technology adoption. Overall, hedge fund growth is underpinned by innovation, institutional adoption, and robust macroeconomic strategies.
The hedge fund industry in the US and EU is evolving rapidly, driven by institutional demand, technological adoption, and regulatory adaptation. AI and machine learning-based strategies are expected to be adopted by 55% of US hedge funds by 2030, compared to 40% in 2025, enhancing portfolio optimization, risk management, and alpha generation. Quantitative strategies, including algorithmic trading, factor-based investing, and systematic hedge fund models, will account for 30% of total hedge fund assets in the US by 2030. ESG integration is gaining traction in the EU, with 50% of EU funds incorporating ESG metrics by 2030 to align with regulatory mandates and attract sustainable capital. Average annual returns are projected at 6–8%, outperforming traditional benchmarks, particularly in volatile markets, which drives investor confidence. Fee structures are stabilizing, with management fees averaging 1.2% and performance fees 18%, reflecting a mild compression trend due to competitive pressures. Regulatory compliance costs, especially in Europe, are expected to increase 15% by 2030, while technological investment in AI, data analytics, and risk modeling is projected to rise 20% by 2030. Hedge funds are increasingly focused on portfolio diversification across equity, credit, macro, and alternative strategies. This combination of technology adoption, regulatory alignment, and institutional demand is expected to accelerate growth, increase transparency, and enhance the long-term resilience of hedge fund portfolios.

Hedge funds in the US and EU are segmented by strategy type, investor profile, and asset class allocation. Event-driven, equity long/short, and multi-strategy funds dominate, representing 45% of total assets under management (AUM) by 2030, followed by credit strategies (25%) and macro/global macro strategies (20%). Institutional investors contribute 70% of total AUM, primarily from pension funds, sovereign wealth funds, endowments, and family offices, while retail and high-net-worth individual allocations account for the remaining 30%. In terms of asset allocation, equity and fixed income dominate with 60% of combined portfolios, while alternative investments including commodities, derivatives, and tokenized assets contribute 40%. AI and quantitative strategies are projected to be implemented in 55% of US funds and 50% of EU funds by 2030, optimizing trading algorithms and risk-adjusted returns. Fee structures are gradually compressing, with management fees averaging 1.2% and performance fees at 18%, reflecting competitive dynamics. Regulatory compliance is increasingly critical in Europe, where 50% of firms will adopt AI-driven compliance platforms to manage reporting and transparency. Hedge fund segments reflect differences in risk appetite, investor mandates, and strategy sophistication, illustrating the diversity and complexity of capital allocation and performance in both US and EU markets.
The US and EU hedge fund markets display regional variations in AUM, adoption, and growth trends. In 2025, the US accounts for 65% of total hedge fund AUM, increasing to 66% by 2030, led by major financial hubs including New York, Chicago, and San Francisco. The EU represents 35% in 2025, decreasing slightly to 34% by 2030 due to stricter regulatory constraints and slower institutional adoption. Hedge fund growth in the US is driven by technology adoption, with 55% of funds implementing AI-based strategies by 2030, compared to 50% in Europe, where ESG integration and regulatory compliance are higher priorities. Emerging European hedge fund markets such as Luxembourg, Ireland, and Switzerland are projected to grow at a CAGR of 9%, benefiting from fund domiciliation incentives, tax efficiency, and regulatory alignment. Average annual returns in both regions are projected at 6–8%, with US funds outperforming slightly in volatile macroeconomic conditions due to larger allocations to quantitative and AI-driven strategies. Regulatory compliance costs in Europe are expected to increase 15% by 2030, while US compliance costs rise modestly. Geography analysis demonstrates that US funds continue to dominate AUM and strategy adoption, while European funds leverage regulatory frameworks and ESG integration to capture specialized investor segments. Regional differences impact asset allocation, portfolio strategies, and investor engagement in hedge fund markets.

The hedge fund competitive landscape in the US and EU features traditional banks, hedge fund managers, and fintech-enabled alternative asset firms. Key US players include Bridgewater Associates, BlackRock, Citadel, and Renaissance Technologies, while European leaders include Man Group, Brevan Howard, and BlueCrest Capital. Hedge fund startups focusing on quantitative and AI-driven strategies are projected to capture 20% of the market share by 2030, particularly in the US. Traditional firms will continue to dominate, holding 50–55% of total assets in both regions, while emerging European hubs like Luxembourg and Ireland attract new fund formations due to favorable regulations. Fee structures remain competitive, with management fees averaging 1.2% and performance fees 18%, while investor demand for high transparency and ESG integration drives adoption of AI analytics. Regulatory compliance, particularly in Europe, is increasingly a differentiator; firms that adopt AI-based compliance tools gain trust and expand capital access. Technological investment in AI, big data, and trading platforms is projected to grow 20% by 2030, improving efficiency and risk-adjusted returns. Consolidation is expected as leading funds merge or partner with fintech platforms to offer end-to-end solutions. Overall, competitive advantage is determined by technology adoption, fund strategy diversity, regulatory compliance, and measurable performance, positioning early adopters to capture growing institutional and retail capital.

Global fixed income markets are projected to expand from $135T in 2024 to $175T by 2030, reflecting a 4.3% CAGR. The U.S. remains the anchor with over $90T in total debt securities, while the EU reaches $35T. Policy stabilization, fiscal expansion, and refinancing cycles drive issuance growth. Long-duration demand from pension and insurance funds continues, while retail access via ETFs rises 35%. China’s inclusion in global indices adds $3T incremental inflows by 2030.

Monetary normalization defines the 2025–2030 era. The U.S. 10-year Treasury yield is expected to settle near 3.4%, while German Bunds stabilize around 2.2%. Central banks gradually unwind balance sheets while maintaining real yields positive by 50–75 bps. Inflation-linked bonds remain in high demand as CPI averages 2.3% in the U.S. and 2.0% in the EU. Fiscal resilience and credible debt management frameworks prevent sharp curve inversions.
Corporate debt issuance grows at 5.6% CAGR, outpacing sovereigns at 3.2%. Refinancing activity peaks in 2026–27 as high-cost pandemic-era debt matures. Financials and utilities lead issuance, while tech and healthcare maintain strong BBB/AA ratings. Investors shift to high-grade corporates as spreads compress by 60 bps vs 2024 levels. ESG-linked issuance exceeds 30% of new corporate debt by 2030, reinforcing sustainability alignment.
Green and sustainability-linked bonds expand from $2.6T in 2024 to $8T by 2030, representing over 12% of total issuance. The EU remains the global hub with €4.2T in outstanding ESG bonds, driven by the EU Green Bond Standard rollout in 2026. The U.S. market catches up post-2027 with municipal green issuances and corporate sustainability frameworks.

Investors rebalance portfolios toward shorter durations, averaging 6.2 years in 2025 vs. 7.8 years pre-2020. Inflation-linked securities (TIPS, OATi) rise 45% in outstanding value by 2030. Asset managers deploy active duration overlays to mitigate volatility as real rates normalize. Structured notes and floating-rate instruments gain traction, while central banks maintain transparency, reducing rate shock risk.
The U.S., EU, and Japan account for over 75% of total issuance. By sector, financials (28%), sovereigns (26%), and utilities (14%) dominate 2030 volumes. The U.S. Treasury’s $1.3T annual issuance program stabilizes supply, while EIB and EU Recovery Fund bonds anchor the EU’s supranational debt markets. Cross-border issuance grows 22% as global investors seek yield arbitrage opportunities.
Private credit emerges as a structural competitor, reaching $3.5T AUM globally by 2030, up from $1.8T in 2024. U.S. private credit yields average 9.1%, narrowing to a 120 bps spread vs. high-yield bonds by 2030. Institutional allocations rise from 6% to 11% of total fixed income portfolios.

Tokenized bond pilots by the European Investment Bank and World Bank have validated digital issuance feasibility. The EU’s DLT Pilot Regime and U.S. SEC sandbox programs together are expected to facilitate over $400B tokenized debt by 2030. These instruments cut settlement times from T+2 to T+0 and reduce issuance costs by 15–20%. Adoption accelerates post-2027 as digital custodians and DeFi integrations mature.
Macro risks include inflation persistence, fiscal slippage, and geopolitical shocks. A sustained energy price rebound could push 10Y yields back above 4%, tightening liquidity. Rising fiscal debt-to-GDP ratios—U.S. (115%) and EU (91%)—may trigger rating watch actions by 2028. However, greater transparency in ESG reporting and digital issuance offsets some systemic stress through improved secondary market efficiency.
The global fixed income market is expected to stabilize into a 2.5–3.0% nominal yield era, characterized by efficiency, liquidity, and ESG depth. Curve normalization completes by 2026, while digitalization enhances price discovery. Portfolio rebalancing into green, private, and tokenized segments redefines benchmark construction by 2030.

Key Takeaways
Key Metrics
The dental insurance market in the U.S. and Europe is projected to grow at a strong pace, reaching $60 billion by 2025. This growth is driven by increasing demand for dental coverage, particularly as consumers seek more comprehensive plans that include preventive care options. The market is expected to grow at a CAGR of 5.4% from 2025 to 2030, as more people opt for dental insurance to manage increasing out-of-pocket healthcare costs.By 2025, 70% of the U.S. population and 50% of Europeans will have dental insurance, reflecting a broader trend toward more accessible and comprehensive oral health coverage.
Market Growth Projection (2025-2030):

The dental insurance market is evolving as more consumers demand greater coverage for preventive care, such as cleanings, checkups, and early intervention for oral health issues. As of 2025, 70% of the U.S. population and 50% of Europeans are expected to have dental insurance coverage, reflecting increasing consumer awareness about the importance of dental health.This growth is also being fueled by insurers offering more affordable plans and expanding coverage options to meet the needs of a diverse customer base, from individuals to families and seniors.
Dental Insurance Coverage Adoption Rate (2025-2030):

Several key trends are driving the growth of dental insurance, including a shift toward preventive care and value-based healthcare models. As dental insurers adapt to these changes, they are expanding their coverage options to include more preventive services, which are in high demand due to the growing awareness of the link between oral health and overall well-being. Additionally, as premiums rise, insurers are focusing on offering more affordable coverage options that balance cost with comprehensive benefits, such as discounts for healthy behaviors or preventive care.
The primary adopters of dental insurance in both the U.S. and Europe are individuals, families, and seniors. As healthcare costs continue to rise, more people are turning to dental insurance to manage these expenses. Insurance providers are increasingly offering tailored plans to meet the unique needs of different customer segments, including policies designed for children, seniors, or people with chronic dental conditions.
 In the U.S., California, Florida, and Texas are leading the way in dental insurance adoption, with high rates of coverage among individuals and families. In Europe, Germany and France are seeing higher-than-average adoption rates, driven by strong healthcare policies and government support for dental care coverage.
Southern and Eastern Europe are lagging behind, but growth is expected as insurers expand their product offerings and address local regulatory and economic challenges.
Dental Insurance Adoption Across Regions (2025):

The competitive landscape for dental insurance is dominated by large providers such as Delta Dental, Cigna, and Aetna, which offer a wide range of plans to meet the needs of consumers across the U.S. and Europe. New entrants in the dental insurance market, especially digital-first insurers, are gaining market share by offering more flexible, affordable, and technology-driven solutions. These providers are leveraging data analytics and AI-driven platforms to offer personalized insurance plans and streamline the claims process.
• Risk‑rating APIs fuse ERP, logistics, and bank data for continuous underwriting.
• Instant trade credit and milestone‑based payouts compress DSO and reduce disputes.
• EU gains from standardized A2A rails; USA blends RTP with card‑rail hybrids.
• Marketplaces/SaaS become primary distribution for embedded B2B finance.
• Tokenized receivables diversify liquidity and price credit dynamically.
• CFO dashboards shift to live cash‑conversion and supplier‑health metrics.
• Data‑governance and audit trails are crucial for regulator and lender trust.
• Winners productize interoperability: ERP, TMS/WMS, e‑invoice, and bank APIs.

Embedded finance routed through industrial platforms scales rapidly through 2030. The USA expands from ~$85B to ~$285B, driven by marketplace penetration in MRO/metals/chemicals and ERP‑embedded payables/receivables finance. The EU grows from ~$78B to ~$260B aided by instant‑payment coverage and open‑banking data portability. Share remains balanced: the USA leads absolute volumes; the EU keeps pace through standardized rails and cross‑border trade. Competition intensifies among platforms that can demonstrate measurable DSO compression and lower loss rates.
Share drivers include procurement digitization depth, ERP integration coverage, and lender participation. Vendors that expose transparent pricing and auditable data flows win trust with CFOs and credit committees.

Manufacturing and wholesale dominate embedded finance GMV by 2030, reflecting dense supplier networks and predictable order cycles. Construction adoption accelerates as milestone‑based payouts, retention management, and bonding integrate with underwriting. Logistics networks benefit from shipment‑linked triggers and IoT telemetry, while B2B marketplaces/SaaS play a pivotal distribution role by embedding credit and A2A payments into procurement flows. Across cohorts, API‑level risk signals replace static credit files; credit is priced at order level with eligibility and limits refreshing on each event.
Buyer priorities: lower total cost of capital, fewer disputes and write‑offs, and automated reconciliation to ERP/GL. Lenders prioritize data quality, audit trails, and standardized contracts to syndicate credit efficiently.
• Continuous underwriting using ERP events, shipment status, and bank account telemetry.
• Instant‑payment rails (A2A/RTP) used for milestone‑based payouts and automated reconciliation.
• Tokenized receivables enable secondary markets and dynamic credit pricing.
• ESG & supplier‑health analytics folded into credit decisions and procurement SLAs.
• Decision hubs unify pricing, risk, and reconciliation with clear KPIs and SLAs.
• Interoperability becomes table‑stakes: ERP, TMS/WMS, e‑invoice, logistics, and bank APIs.
• Fraud/dispute tooling integrates evidence (PoD, IoT, EDI) to reduce leakage.
• Standardized audit packs improve regulator and lender confidence.
• Manufacturing: Supplier‑finance and dynamic discounting at PO/ASN/invoice milestones; strong ERP coverage.
• Wholesale Distribution: Catalog‑driven credit activation; multi‑supplier limits and quick eligibility refresh.
• Construction & Materials: Milestone/retention‑aware payouts; bonding and lien‑waiver workflows integrated.
• Logistics: Shipment‑triggered payments and fuel/maintenance credit; telematics for risk control.
• B2B Marketplaces/SaaS: Primary distribution for embedded credit, A2A payments, and risk APIs; data network effects.
Cross‑segment success depends on measurable DSO reduction, fewer disputes, and lender participation depth.

The USA represents ~48% of 2030 embedded finance volume, reflecting market scale and platform penetration. The Euro Area contributes ~36% on the back of instant payments (SEPA Inst) and open‑banking mandates; the UK & Nordics add ~10% with high API adoption; CEE & Others provide ~6% as regional marketplaces scale. Geography influences rail choice—EU skews to A2A; USA blends RTP with card hybrids—yet both converge on automated reconciliation and continuous underwriting at the order level.
Competitors span (1) vertical B2B marketplaces; (2) ERP‑embedded finance modules; (3) banks and fintech lenders; (4) payment providers integrating A2A/RTP; and (5) credit/identity data networks. Differentiation rests on data coverage (ERP, logistics, bank feeds), speed and explainability of underwriting, dispute/fraud tooling, and transparent economics. Expect consolidation around platforms that deliver live cash‑conversion analytics, risk‑rating APIs, and auditable data pipelines for lenders and regulators.
The market for composable and modular banking solutions in the USA is expected to reach $10.5 billion by 2025, growing at a CAGR of 22% from 2025 to 2030. This growth is being driven by increasing demand for flexible, customizable banking platforms that enable financial institutions to deliver more personalized and scalable services to customers. 
By 2025, 45% of banks and fintechs in the US will have adopted composable banking models, enabling them to offer tailored solutions to meet customer demands and regulatory requirements. This market expansion is set to create new revenue opportunities for BaaS providers and reshape the financial services sector in the USA.
Market Growth Projection (2025-2030):

 Composable and modular banking solutions are transforming the way financial institutions operate by providing them with the flexibility to offer highly customized products and services. The rise of BaaS players is enabling traditional banks and fintech firms to innovate quickly by integrating third-party solutions and reducing operational costs. These solutions are expected to improve customer satisfaction by providing faster, more tailored banking services. The adoption of modular banking platforms is expected to grow at 40% annually from 2025 to 2030, driven by demand for more agile and scalable financial infrastructure.
Composable Banking Adoption Rate in the USA (2025-2030):

 Key trends driving the growth of composable and modular banking include the rise of open banking, the need for more personalized financial services, and the growing demand for API-driven solutions. Financial institutions are increasingly adopting these technologies to respond to evolving customer expectations and regulatory pressures. Another key trend is the expansion of BaaS platforms, which are enabling fintechs and non-bank financial institutions to access banking services through APIs. This has led to a significant increase in the number of startups and challengers in the fintech space, further disrupting the traditional banking industry. 
 The major adopters of composable and modular banking solutions in the USA are large banks and fintech firms, who are using these platforms to offer more customized and customer-centric services. Smaller banks and credit unions are also beginning to explore these solutions, but adoption rates are slower due to the complexity and initial costs. The fintech sector is experiencing the fastest growth in adoption, as startups and challengers leverage modular platforms to scale quickly and compete with traditional financial institutions. The modularity and flexibility offered by these platforms allow for rapid innovation and adaptability in response to market demand.
 In the USA, Silicon Valley and New York are the leading hubs for composable and modular banking adoption, driven by the presence of major fintech firms, venture capital, and a culture of innovation. Other regions, such as Chicago and Texas, are beginning to catch up, with more traditional banks exploring BaaS platforms to integrate digital banking services. The demand for composable banking solutions is expected to rise across midwestern and southern regions, as fintech infrastructure improves and regulatory pressures increase.
Composable Banking Adoption Across US Regions (2025):

The competitive landscape for composable and modular banking in the USA is dominated by new BaaS players such as Synapse, Railsbank, and Finix, which offer flexible, API-driven banking platforms. These companies are enabling traditional financial institutions and fintech firms to integrate banking services seamlessly and offer innovative products. Major players in the traditional banking space, such as Goldman Sachs and JPMorgan Chase, are also entering the BaaS market, leveraging their infrastructure and capital to compete with fintechs and challengers.