

68 Circular Road, #02-01 049422, Singapore
Revenue Tower, Scbd, Jakarta 12190, Indonesia
4th Floor, Pinnacle Business Park, Andheri East, Mumbai, 400093
Cinnabar Hills, Embassy Golf Links Business Park, Bengaluru, Karnataka 560071


Connect With Us


68 Circular Road, #02-01 049422, Singapore
Revenue Tower, Scbd, Jakarta 12190, Indonesia
4th Floor, Pinnacle Business Park, Andheri East, Mumbai, 400093
Cinnabar Hills, Embassy Golf Links Business Park, Bengaluru, Karnataka 560071
Connect With Us
68 Circular Road, #02-01 049422, Singapore
Revenue Tower, Scbd, Jakarta 12190, Indonesia
4th Floor, Pinnacle Business Park, Andheri East, Mumbai, 400093
Cinnabar Hills, Embassy Golf Links Business Park, Bengaluru, Karnataka 560071
Request Custom Transcript
Private Jet Membership Models: A $10B Subscription Market by 2032.
The U.S. private jet membership market is forecasted to grow from $4.1B in 2025 to $10.2B by 2032, marking a CAGR of 13.8%. Demand for subscription-based aviation models is accelerating as business travelers, high-net-worth individuals (HNWIs), and corporate clients seek flexible, on-demand air mobility solutions. By 2032, over 60% of private flight bookings in the U.S. will occur through membership or fractional ownership platforms, driven by fleet digitalization, sustainability incentives, and expanding mid-tier clientele. The shift from ownership to access-based aviation signals a permanent transformation in private air travel economics.
What's Covered?
Report Summary
Key Takeaways
- Market size: $4.1B → $10.2B (CAGR 13.8%).
- 60% of private jet users to shift to subscription or membership models by 2032.
- HNWIs and corporate travelers make up 75% of total spend.
- Mid-tier memberships under $100K annually growing at 17% CAGR.
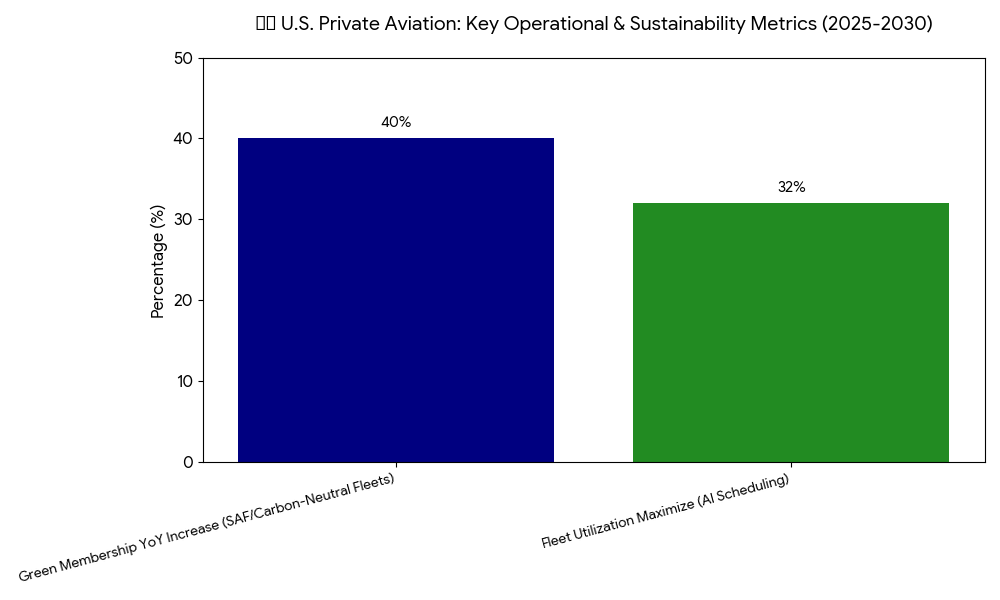
- Sustainability-driven memberships (carbon-neutral fleets) up 40% YoY.
- Digital booking platforms to represent 70% of new memberships by 2030.
- Fractional ownership programs forecast to reach $3.8B valuation.
- Fleet utilization efficiency to improve by 32% via AI scheduling.
- Hybrid air mobility firms entering market with electric VTOL integration by 2031.
- Top operators: NetJets, Wheels Up, XO, Flexjet, and Jet Linx dominate 80% of the market.
Key Metrics
Market Size & Share
The U.S. private jet membership market is set to expand from $4.1B in 2025 to $10.2B by 2032, driven by changing traveler behavior and economic accessibility. Membership-based aviation will account for 60% of total private jet usage, up from 42% in 2025. High-net-worth individuals (HNWIs) remain the dominant segment, but mid-tier professionals and corporate clients are fueling subscription expansion through tiered access programs costing $50K–$250K annually. Fractional ownership, valued at $3.8B by 2032, offers predictable cost structures, while shared seat models are emerging for semi-private flights. The market’s scalability is supported by fleet digitization, predictive maintenance, and integrated digital booking systems enhancing reliability and cost-efficiency.
Market Analysis
Between 2025 and 2030, the U.S. private aviation industry will see accelerated transition from asset ownership to service access. The pandemic-triggered spike in private travel created a new baseline for convenience-driven membership models. Operators are leveraging AI-driven scheduling algorithms to maximize fleet utilization (+32%), while digital membership apps streamline booking and payment. Corporate clients, representing 45% of membership contracts, seek predictable flight-hour pricing and global access networks. The adoption of carbon-neutral fleets and sustainable aviation fuel (SAF) incentives has led to a 40% YoY increase in green memberships. By 2032, hybrid aircraft and electric VTOL integrations will expand short-range travel memberships, further diversifying the segment.
Trends & Insights
- Shift from Ownership to Access: 60% of private flyers adopting subscription models by 2032.
- Tiered Membership Expansion: Mid-tier programs below $100K growing at 17% CAGR.
- Digital Aviation Ecosystems: 70% of new memberships via mobile or web platforms.
- AI Optimization: 32% boost in fleet utilization and 15% cost reduction.
- Sustainability Demand: 40% growth in carbon-offset and SAF-based memberships.
- Dynamic Pricing Algorithms: Real-time flight-hour pricing gaining corporate adoption.
- Hybrid Mobility Integration: eVTOL-linked programs by Joby, Archer, and Flexjet by 2031.
- Corporate ROI Models: Subscription clients saving 12–18% on annual travel budgets.
- Fractional Ownership Consolidation: Mergers expected among second-tier operators.
- Loyalty Ecosystems: Integration of air miles, crypto tokens, and exclusive benefits into membership tiers.
These trends illustrate the commercial maturity of private aviation access programs, evolving into mainstream mobility alternatives for affluent and corporate travelers.
Segment Analysis
The market segments include fractional ownership (40%), membership subscription programs (35%), on-demand charters (15%), and hybrid/eVTOL air mobility access (10%). Fractional ownership dominates with 40% share, allowing members to purchase jet shares for fixed flight hours. Subscription programs, at 35%, appeal to customers seeking flexible travel at predictable costs. On-demand charters, accounting for 15%, are supported by real-time marketplaces like XO and FlyExclusive. Emerging eVTOL-based memberships, currently 10%, are expected to double by 2031, connecting regional hubs for short-range mobility. Across segments, AI-driven demand management systems and dynamic scheduling are improving profitability and operational efficiency.

Geography Analysis
The U.S. remains the global leader in private jet membership adoption, contributing 78% of worldwide subscription-based private aviation revenues. The Northeast Corridor (New York–Boston–Washington) and California–Texas routes dominate 55% of total membership flight demand, primarily serving corporate executives and HNWIs. The Sunbelt states, including Florida, Arizona, and Nevada, are emerging as key secondary hubs due to residential migration and lifestyle-driven travel. By 2032, sustainable jet fleets concentrated in California and Texas will account for 30% of new membership contracts, reflecting a nationwide shift toward eco-friendly air mobility solutions.
Competitive Landscape
The market is led by NetJets, Wheels Up, XO, Flexjet, and Jet Linx, collectively controlling 80% of the private jet membership space. NetJets dominates fractional ownership and premium-tier subscriptions, while Wheels Up leads in mid-tier membership models targeting corporate accounts. XO and Jet Linx are expanding through dynamic pricing and AI-based scheduling platforms, while Flexjet is integrating sustainability analytics and electric aircraft readiness. New entrants like Surf Air Mobility and Blade Air Mobility are blending subscription models with eVTOL capabilities. The competitive edge now depends on technology integration, sustainability commitment, and scalable membership pricing tailored to different traveler classes.
Report Details
Proceed To Buy
Want a More Customized Experience?
- Request a Customized Transcript: Submit your own questions or specify changes. We’ll conduct a new call with the industry expert, covering both the original and your additional questions. You’ll receive an updated report for a small fee over the standard price.
- Request a Direct Call with the Expert: If you prefer a live conversation, we can facilitate a call between you and the expert. After the call, you’ll get the full recording, a verbatim transcript, and continued platform access to query the content and more.
68 Circular Road, #02-01 049422, Singapore
Revenue Tower, Scbd, Jakarta 12190, Indonesia
4th Floor, Pinnacle Business Park, Andheri East, Mumbai, 400093
Cinnabar Hills, Embassy Golf Links Business Park, Bengaluru, Karnataka 560071
Request Custom Transcript
Related Transcripts


$ 1395

68 Circular Road, #02-01 049422, Singapore
Revenue Tower, Scbd, No.52-53, Jakarta 12190, Indonesia
Cinnabar Hills, Embassy Golf Links Business Park, Bengaluru, Karnataka 560071
4th Floor, Pinnacle Business Park, Andheri East, Mumbai, 400093


68 Circular Road, #02-01 049422, Singapore
Revenue Tower, Scbd, Jakarta 12190, Indonesia
4th Floor, Pinnacle Business Park, Andheri East, Mumbai, 400093
Cinnabar Hills, Embassy Golf Links Business Park, Bengaluru, Karnataka 560071