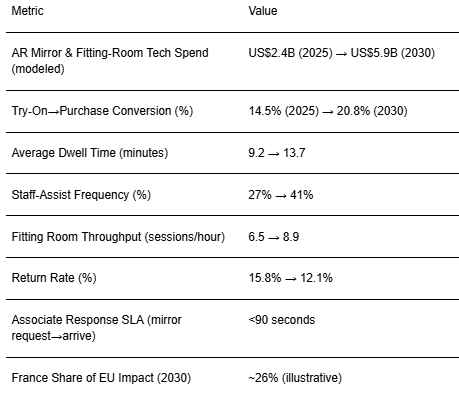
Luxury boutiques are turning fitting rooms into data-rich showrooms. From 2025 to 2030, Europe’s leaders deploy augmented‑reality (AR) mirrors and journey mapping to connect discovery, try‑on, checkout, and post‑purchase service. We model EU spending on AR mirrors and fitting‑room tech growing from ~US$2.4B in 2025 to ~US$5.9B by 2030. France leads on experiential design and boutique density, linking store theatrics with measurable outcomes. AR mirrors now function as clienteling consoles: body‑aware overlays, curated looks, and one‑tap size/color requests. Journey mapping stitches signals across POS, appointment apps, CRM, and clienteling. The result is higher try‑on→purchase conversion, longer dwell, greater staff‑assist frequency, faster throughput, and lower returns via better fit/expectations. But value arrives only with disciplined ops: calibrated lighting/cameras, privacy‑by‑design, reliable sizing recommendations, and fast associate response. KPI guardrails matter. Median programs can plausibly lift try‑on→purchase CVR from ~14.5% to ~20.8%, dwell from ~9.2 to ~13.7 minutes, staff‑assist frequency from ~27% to ~41%, and throughput from ~6.5 to ~8.9 sessions/hour while reducing return rates from ~15.8% to ~12.1% by 2030.
.png)
1. Design mirrors as clienteling consoles, not gadgets staff workflows drive ROI.
2. Map journeys end‑to‑end; measure conversion and returns by step, not channel.
3. Fit intelligence and alterations reduce returns and increase confidence.
4. Accessibility & privacy by design: comfort modes, consent, and clear retention limits.
5. Associate response SLAs (<90s) sustain momentum and satisfaction.
6. Visual merchandising + AR scenes increase dwell and attachment sales.
7. France advantage: atelier services and cultural partnerships elevate experience.
8. CFO dashboard: try‑on→purchase CVR, dwell, staff‑assist %, throughput, return %.

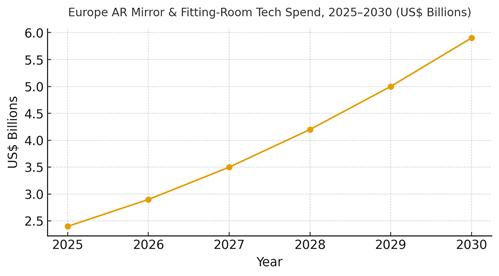
EU AR mirror and fitting‑room tech spend is modeled to expand from ~US$2.4B in 2025 to ~US$5.9B by 2030 as boutiques prioritize measurable experience over generic digitalization. France leads with ~26% impact share by 2030, driven by maison density and service ladders (personalization, repair, appointments). The line figure shows the compounded trajectory. Categories with high try‑on dependence RTW, footwear, leather goods capture the earliest gains; beauty benefits through regimen guidance and sampling prompts.
Share dynamics: brands with integrated inventory and clienteling gain the most, since AR prompts convert only when fulfillment is fast and accurate. Execution risks include camera sensitivity and fit bias. Mitigations: diverse training data, lighting calibration, and human‑in‑the‑loop fitting advice. Measurement must cover try‑on→purchase CVR, dwell, staff‑assist %, throughput, and return % by boutique to validate ROI alongside brand equity.

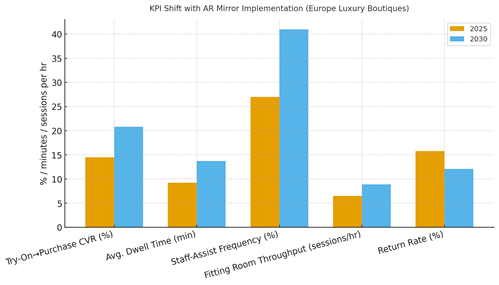
AR mirrors shift store performance when tied to staff workflows and inventory. We model try‑on→purchase CVR improving from ~14.5% to ~20.8%; dwell time from ~9.2 to ~13.7 minutes; staff‑assist frequency from ~27% to ~41%; throughput from ~6.5 to ~8.9 sessions/hour; and return rate falling from ~15.8% to ~12.1% by 2030. Enablers: accurate body/fit guidance, quick size/color retrieval, appointment integration, and frictionless checkout. Barriers: hardware uptime, privacy concerns, and inconsistent lighting.
Financial lens: attribute to incremental margin after returns and staffing; model capex/opex amortization; and quantify exchange vs refund outcomes. The bar chart summarizes directional shifts when AR mirrors operate within a disciplined phygital journey.

1) AR as clienteling: mirrors surface curated looks and service options; staff convert. 2) Privacy by default: opt‑in capture, session‑local processing, and short retention. 3) Fit intelligence: body‑aware sizing and alteration prompts reduce returns. 4) Appointment‑led flows: scenes and stock pre‑staged for clients. 5) Edge compute + remote diagnostics: uptime and latency resilience. 6) Accessibility: comfort modes, captions, and alternative flows. 7) Scene experimentation: weekly tests for prompts, layouts, and lighting. 8) Omnichannel links: wishlists, one‑tap orders, and home delivery. 9) Sustainable ops: fewer unnecessary try‑ons and smarter returns. 10) Measurement discipline: CVR, dwell, staff‑assist %, throughput, return %.
RTW & Couture: Scenes for silhouettes and personalization; alteration guidance. Leather Goods: Pairing suggestions and personalization credits. Footwear: fit and gait cues; size exchanges. Beauty: shade match and regimen guidance with sampling. Jewelry & Watches: AR scale previews; appointment hand‑offs. Across segments, define prompts, consent defaults, and staff SLAs; track segment‑level CVR, dwell, throughput, and return % to guide investment.
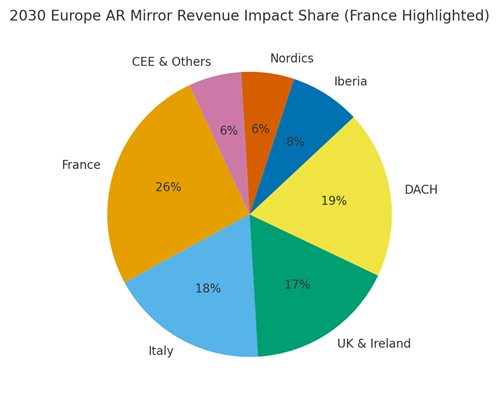
France is projected to capture ~26% of Europe’s AR mirror revenue impact by 2030, followed by DACH (~19%), Italy (~18%), UK & Ireland (~17%), Iberia (~8%), Nordics (~6%), and CEE & Others (~6%). Paris anchors flagship rollouts; regional boutiques translate AR into service and alterations. Localization: French language assets, cultural styling, consent signage, and accessibility norms. The pie figure reflects the regional mix.
Execution: centralize analytics and content templates; let boutiques adapt scenes and staffing. Measure geography‑specific CVR, dwell, staff‑assist %, throughput, and return %; tune SLAs to store density and traffic patterns.

Incumbents pair boutique networks and clienteling depth with premium hardware; challengers compete on computer vision, edge compute, and analytics UX. Differentiation vectors: (1) fit accuracy and lighting resilience, (2) associate workflow integration, (3) privacy/accessibility compliance, (4) inventory and alterations integration, and (5) remote monitoring uptime. Procurement guidance: demand open APIs, privacy‑by‑design certifications, hardware SLAs, and proof of incremental margin after returns. Competitive KPIs: try‑on→purchase CVR, dwell, staff‑assist %, throughput, return %, and NPS.
1. Identity‑first stacks maximize instant approvals while lowering chargebacks—conversion and risk goals align.
2. Behavioral biometrics plus device intelligence defeat bots/emulators and reduce step‑up friction.
3. Deepfake defenses require liveness (selfie/voice) and ongoing model‑risk tests, not just vendor claims.
4. Graph resolution with consented telco/payment tokens outperforms cookie/device‑ID heuristics.
5. Manual review should be exception‑only with clear escalation paths and feedback loops into models.
6. Bias/fairness tests and adverse‑action notices are essential for compliance and trust.
7. Red‑team simulations (synthetic IDs, emulator farms) harden controls before peak seasons.
8. Telemetry (FPR, chargeback rate, latency, step‑up %) must be finance‑grade and auditable.

Fraud risk and decisioning are two sides of the same market: the share of orders approved instantly becomes a primary competitive metric. In this illustrative outlook, US attack rates decline from ~3.8% of transactions in 2025 to ~2.4% by 2030, while instant‑approval share rises from ~42% to ~76%. Share of prevention spend shifts toward identity‑resolution graphs, behavioral biometrics, and liveness tooling integrated directly into checkout SDKs and payout flows. Marketplaces expand their share of tooling spend as seller onboarding, payout, and KYC become persistent attack targets.
Distribution is bar‑belled: large enterprises standardize stacks and build in‑house decisioning, while SMBs adopt managed‑service models bundled with payments or commerce platforms. Vendors that can prove low latency, high approval precision, and verifiable deepfake blocking capture disproportionate share. By 2030, instant‑approval leadership and low false positives translate directly into higher conversion and lower CAC via trust signals and fewer step‑ups.

Unit economics improve as false positives and manual reviews fall while approval latency shrinks. In this outlook, DTC retailers drive false positives from ~1.8% to ~0.9% and manual reviews from ~8% to ~3.5%; marketplaces see similar halving as seller KYC and payout controls mature; subscription apps converge on ~1.0% false positives and ~4% manual review. Median decision latency compresses to ~20–35 seconds, even with selective step‑up liveness. Cost drivers include data licensing (telco/device/payment tokens), model training/serving infra, and human review. Benefits: higher conversion, fewer chargebacks, lower labor, and stronger LTV from reduced insult rates.
Risk vectors evolve: ATO via SIM‑swap and OAuth abuse; synthetic IDs seeded with low‑risk spend; promo/returns fraud; and deepfake‑assisted document forgery. Mitigations: multi‑signal identity graphs; continuous behavioral profiling; cryptographic binding of sessions to devices; watermark/liveness for media uploads; and policy engines that throttle high‑risk promotions. Programs should be governed by clear SLAs (latency, FPR, review rate), quarterly red‑team tests, and bias audits with remediation plans.

• Behavioral biometrics at checkout and login measure micro‑movements, rhythm, and hesitation hard to spoof at scale.
• Deepfake detection pairs passive signals (blink, texture) with active prompts and server‑side liveness cryptograms.
• Identity graphs enrich with consented telco/device/payment tokens; graph features drive instant approvals.
• Privacy‑preserving techniques (federated learning, tokenization) reduce PII movement while improving accuracy.
• Real‑time policy engines coordinate price/promo abuse limits with fraud thresholds to cut arbitrage.
• Explainable decisions and adverse‑action workflows become procurement requirements.
• Shared threat intel across platforms (hashes, device clusters) shortens dwell time of new attacks.
• Managed fraud services grow for SMBs; enterprises retain control planes with vendor signals via APIs.
• DTC Retail: focus on promo/returns abuse and payment fraud; leverage device binding and address/identity validation; minimize friction with selective liveness for risky cohorts.
• Marketplaces: seller onboarding KYC, payout risk, and triangulation scams dominate; maintain continuous monitoring and velocity checks; verify bank/tax identities and monitor inventory flows.
• Subscription/Apps: account sharing and password spraying drive ATO; integrate telco signals and challenge flows for suspicious sessions; protect recurring billing against chargeback farms.
• BNPL/Alt‑pay: fast credit decisions heighten synthetic‑ID risk; require strong identity resolution and repayment telemetry.
Readiness is strongest in the Northeast and West where data talent, telco/payment partners, and platform vendors cluster; the South and Midwest gain as omnichannel commerce scales and carrier coverage improves. The stacked criteria—data signals, payment rails/alt‑pay, compliance readiness, carrier/device coverage, and organization/data talent—indicate where instant identity resolution can reach production SLAs first.
Implications: start rollouts in regions with robust signals and engineering capacity; co‑design consent and disclosures with legal; establish incident rollback paths; and maintain vendor diversity to avoid single‑point failures in signals or liveness.

The ecosystem includes behavioral biometrics providers, identity/liveness vendors, device and telco‑signal networks, graph risk platforms, and orchestration engines that route calls and manage policies. Differentiators: latency SLAs, breadth of consented signals, deepfake‑blocking efficacy, explainability, and integration to checkout/payout SDKs. Managed services bundle decisions for SMBs; enterprises construct control planes and swap signal vendors without code changes via adapters. Procurement shifts to outcome‑based contracts indexed to FPR, approval precision, latency, and verified deepfake catch‑rates. Winners publish audit trails, fairness metrics, and red‑team results, earning trust from risk and compliance while enabling marketing to move fast without compromising safety.
1. GenAI shifts merchandising from static catalogs to adaptive narratives and creatives.
2. Dynamic content becomes default; DCO/DPA lift ROAS and onsite conversion when tied to clean first‑party data.
3. Micro‑influencers drive higher engagement and trust; GenAI improves creator matching and brief quality.
4. Creative velocity is a KPI: cost per asset and variant test speed predict performance gains.
5. Guardrails (brand rules, QA, synthetic media disclosure) are mandatory under EU AI Act expectations.
6. Winners run disciplined experiments and prove incrementality, not just content volume.
7. Retail, beauty, CPG, and consumer electronics see the fastest ROI from attribute‑rich storytelling.
8. CFO‑credible dashboards unify media, creator costs, and contribution margin after returns.

Global AI in retail is projected to expand rapidly through 2030. Against this backdrop, we model an AI‑in‑merchandising sub‑segment for USA+EU rising from ~US$7.0B (2025) to ~US$20.5B by 2030. This model triangulates: (1) published AI‑in‑retail market baselines and CAGRs, (2) enterprise AI adoption in marketing/merchandising functions, and (3) cost deflation in creative production observed in case studies. Growth drivers include first‑party data mandates, cookieless targeting shifts, and the proliferation of dynamic content across paid and owned channels. Micro‑influencer programs expand as brands seek trusted voices and measurable engagement at lower CPMs. Risks include governance under the EU AI Act, model bias, and uneven performance from pilots lacking data plumbing or experimentation discipline.
Share dynamics: fashion and beauty lead in narrative‑rich merchandising, followed by consumer electronics (attribute depth) and home categories. Retailers with strong CDP/PIM foundations outgrow peers by rendering real‑time product narratives and shoppable modules that reflect local context, inventory, and price. Unit economics improve as content cycle times compress and variant testing scales. The line chart illustrates the compounding sub‑segment growth in USA+EU through 2030.
Execution guidance: attribute mapping and content schemas should be standardized across PIM and CMS; human‑in‑the‑loop QA must precede full rollout; and legal teams should review disclosure language for synthetic media. Measurement should prioritize incremental revenue per 1,000 rendered variants, not just output volume.

Capability adoption will be uneven but material by 2030. We project personalized storytelling adoption among mid/large brands/retailers increasing from ~28% (2025) to ~62% (2030), dynamic content/DCO from ~36% to ~74%, and micro‑influencer campaigns from ~41% to ~68%. Drivers: cost deflation, better tooling, and measurable ROAS/engagement gains particularly when linked to first‑party data. Personalized storytelling lifts discovery and AOV in attribute‑rich categories (beauty, consumer electronics); DCO optimizes creative fit across placements; micro‑influencers deliver higher engagement than macro‑led campaigns and create reusable UGC for commerce surfaces. Barriers include data silos, weak experimentation, and creative QA debt. Organizationally, leaders are building cross‑functional merch‑media teams with creative ops and data engineering embedded.
Financial lens: treat GenAI as a performance channel. Track cost per approved asset, variant test velocity, DCO win rate, and incremental margin after media/creator costs. Tie rewards and budgets to proven lift, not content volume. Vendor strategy: standardize briefs and templates; keep a modular stack (creative generation, templating, approval workflow, DCO, influencer matching) to avoid lock‑in. The bar chart depicts the step‑function in adoption across the three core capabilities by 2030.

1) Creative velocity as strategy: Organizations compress cycle times by >50%, enabling seasonal and persona‑level variants that would be cost‑prohibitive manually. 2) Agentic creative ops: AI agents assist with brief generation, asset QA, and compliance checks raising throughput without sacrificing brand guardrails. 3) First‑party data flywheel: Merch storytelling and DCO improve as CDP signals enrich; content variants become a vehicle to learn preferences. 4) Micro‑influencer trust premium: Smaller creators sustain higher engagement; AI improves matching, briefs, and content remixing for retail assets. 5) Retail media networks (RMNs): Dynamic merchandising assets flow into onsite and offsite inventory, blending trade marketing and performance media. 6) Compliance by design: EU AI Act timelines push disclosure, provenance, and risk classification; brands adopt audit trails and watermarking. 7) Outcome‑based funding: CFOs reallocate budget from static production to experiments with proven incrementality. 8) Category nuance: beauty/fashion favor narratives and UGC; CE and home benefit from spec‑rich copy and comparison modules; grocery uses DCO for price/availability swings.
Retail & Fashion: Highest narrative intensity; combine look books with shoppable stories and size/fit guidance; pair with micro‑influencers for social proof. Beauty & Personal Care: Routine‑based storytelling, before/after assets, and ingredient explainers; high ROI from creator UGC remixed into retail placements. Consumer Electronics: Attribute‑heavy copy, spec comparisons, and FAQ‑style stories; DCO adapts to price/availability; influencers skew to niche experts. CPG & Grocery: Weekly dynamic modules reflecting price, promos, and availability; recipe stories and bundle suggestions. Home & DIY: Project‑based stories and visual planners; micro‑influencers demonstrate use‑cases. Cross‑segment KPIs: variant test velocity, incremental revenue per 1k renders, DCO win rate, micro‑influencer CAC vs ROAS, and return‑rate impact from better fit/expectation management. Risks include content drift, QA gaps, and over‑reliance on synthetic visuals without disclosure. Mitigations: enforce brand rule libraries, human‑in‑the‑loop signoff, and automated checks for claims, IP, and bias.
By 2030, we estimate USA will represent ~58% of AI‑in‑merchandising spend vs EU at ~42%, reflecting ad/retail media scale, vendor ecosystems, and merchandising intensity. USA advantages include RMN maturity and higher test velocity; EU advantages include strong omnichannel retailers and tightening compliance that may improve consumer trust. Country nuance: in the EU, disclosure and provenance under the AI Act shape creative workflows; in the USA, platform policy and state privacy laws drive data contracts. Operationally, harmonize templates and prompts globally but maintain regional brief variants (language, regulatory copy, cultural cues). For cross‑border brands, centralize the content factory while granting local teams budget for micro‑influencer selection and creative tweaks. The pie chart reflects this split and underscores the need for localized creator networks and compliance processes.

Vendor landscape spans: creative generation (text/image/video), templating and brand rules, creative ops/workflow, DCO/DPA engines, and influencer tools. Enterprise stacks integrate CDP/PIM/CMS with experimentation and RMN delivery. Incumbents with DCO and retail media integrations hold an edge; challengers innovate on agentic workflows and creator marketplaces. Differentiation vectors: (1) throughput and QA automation, (2) first‑party data fusion, (3) compliance tooling (provenance, watermarking, audit logs), (4) integration breadth. Case signals show material cost savings and cycle‑time compression; however, many organizations stall at pilot stage without data readiness or clear governance. Competitive KPIs: approved‑asset throughput, cost per asset, DCO win rate, creator content re‑use rate across channels, and incremental margin after media/creator costs. Strategic moves: standardize brief and prompt libraries; adopt modular procurement to avoid lock‑in; run quarterly creative system audits; and establish disclosure policies aligned to regional rules.
Sustainability is no longer optional in European retail. With the EU Packaging & Packaging Waste Regulation (PPWR) coming into effect, brands are investing in recyclable, reusable, and compostable packaging. By 2025, over 78% of consumers in Western Europe say that packaging sustainability influences purchase decisions, while premium and FMCG brands are expected to invest €3–3.5 billion in eco-friendly packaging innovations by 2030. Regulatory mandates require 100% recyclability by 2030, driving higher adoption of bio-based materials and refillable packaging.
Cost implications are significant: packaging expenses are projected to rise 10–15%, particularly in high-volume categories such as beverages, personal care, and food. Brands that innovate with modular, lightweight, or multi-use designs are mitigating costs while increasing consumer appeal. Pilot programs in Germany, France, and the Nordics indicate that eco-packaging can improve customer engagement by 12–18% and reduce logistics costs by 5–7% due to optimized pack design and reduced material weight.
Sustainable packaging is now a strategic lever for margin protection, regulatory compliance, and brand loyalty. Retailers that integrate eco-friendly designs while maintaining cost efficiency will capture both market share and consumer trust across Europe.
5 Key Quantitative Takeaways (2025–2030):
Download the full report to explore material innovations, cost mitigation strategies, and regulatory compliance roadmaps for sustainable retail packaging in Europe.
1. U.S. and EU RMN revenues double by 2030, led by authenticated audiences and closed-loop ROI.
2. Incremental ROAS improves as identity graphs and attribution standards mature.
3. U.S. dominance comes from faster API and self-service enablement; EU leads in premium media trust.
4. Retailers monetize shopper attention with scalable adtech and transparent performance metrics.
5. Preferred and self-service models democratize RMN access for mid-size brands.
6. Interoperability, privacy compliance, and data-sharing governance remain critical barriers.
7. Unified ROI benchmarks drive capital reallocation from upper-funnel to commerce-driven budgets.
8. CFO dashboard: revenue growth, ROI %, ad yield, access model share, and media waste reduction.

RMN ad revenues across the U.S. and EU are modeled to expand from ~US$38B in 2025 to ~US$83B by 2030, at a CAGR of ~16%. U.S. networks account for ~60% of spend, driven by scale and automation, while EU networks capture 40%, supported by premium placements and omnichannel maturity. The line figure illustrates this compounding growth.
By category, grocery and mass retail anchor the ecosystem (~42% share), followed by electronics (~18%), beauty/personal care (~14%), and home goods (~11%). Growth accelerates in travel, pharmacy, and QSR sectors as data partnerships expand. Monetization hinges on authenticated traffic, verified conversions, and interoperable ID layers that unify measurement across online and in-store. Execution risks: siloed data, cross-border privacy constraints, and inconsistent creative standards.

RMN ROI and efficiency benchmarks diverge between the U.S. and EU but converge on closed-loop performance. By 2030, U.S. networks deliver ~3.8x ROAS with higher automation and transparency; EU networks average ~3.2x as regulations emphasize consent and context. Retailer ROI ranges from 28–32%, advertiser ROI 25–29%, and ad yield per impression improves to US$0.64 (U.S.) and US$0.52 (E.U.). The bar chart summarizes comparative KPIs.
Enablers: scalable API-based buying, privacy-safe clean rooms, and AI-driven optimization. Barriers: fragmented currencies, inconsistent viewability standards, and underreported offline attribution. Financially, retailers earn incremental margin dollars per impression while advertisers optimize cross-channel reach and incrementality. Success depends on attribution integrity and data-sharing interoperability.

1) RMNs emerge as the second-largest digital ad channel after search. 2) Closed-loop attribution and clean-room integrations standardize ROI proof. 3) Preferred partner and self-service models expand brand accessibility. 4) Dynamic creative optimization (DCO) connects product feeds to ads in real time. 5) Cross-retailer ID graphs drive multi-channel frequency capping and deduplication. 6) Premium shoppable video and CTV inventory attract brand budgets. 7) Interoperable metrics across RMNs simplify media mix modeling. 8) AI-based ad yield management lifts floor prices. 9) Privacy innovations consent APIs and differential privacy enable compliant personalization. 10) RMN data feeds inform upstream product and pricing strategies.
Grocery/Mass Retail: High volume, low margin; focus on incrementality and shelf availability. Beauty & Personal Care: Influencer collaboration and shoppable video drive engagement. Electronics: Offsite CTV and onsite bundles dominate. Fashion: Self-service access and creative autonomy increase ROI. Home & DIY: Premium contextual placements and store co-op ads scale. Travel & QSR: Location-based retail audiences power dynamic campaigns. Across segments, track incremental ROAS, ad yield, and verified conversion metrics to allocate capital efficiently.
By 2030, ad spend distribution by brand access model is modeled as Preferred Partner Programs (~28%), Self-Service Platforms (~26%), Open API Access (~22%), Managed Service Deals (~16%), and Co-Branded Retail Partnerships (~8%). U.S. adoption of APIs and automation drives openness, while EU retailers favor curated partner ecosystems for compliance and quality. The pie figure illustrates the evolving mix.
Execution priorities: centralize measurement and data governance; harmonize taxonomy and consent signals; and expand retail media cross-network exchanges to reduce fragmentation. Regional success hinges on transparency, scale, and sustainable advertiser trust.

U.S. leaders (Amazon, Walmart Connect, Target Roundel) dominate scale, while EU players (Tesco Media, Carrefour Links, Ahold Connect, Schwarz Media) lead on privacy and omnichannel integration. Differentiation vectors: (1) authenticated traffic, (2) clean-room interoperability, (3) retail media stack ownership, (4) brand experience quality, and (5) cross-border compliance maturity. Procurement guidance: prioritize RMNs with transparent attribution, auditable APIs, and measurable sales lift. Competitive KPIs: ROAS, ad yield, access model mix, verified conversions, and cost per incremental sale.
1. Profitable growth era: GMV up ~€64B with margin discipline, not ad spend alone.
2. CAC re-bases lower on channel diversification, MMM, and creative iteration.
3. Gross margin +600 bps via mix, pricing science, and promo guardrails.
4. Fulfillment cost −20% from multi-node inventory and density-aware SLAs.
5. Returns −3.5 pp through fit guidance and content standards.
6. LTV/CAC expands to ~3.4× via subscriptions, memberships, replenishment.
7. DACH & UK/I lead absolute GMV; Southern Europe and CEE lead % growth.
8. Operating model edge beats brand hype: contribution-margin governance is decisive.

Europe’s D2C channel scales from an estimated €78B in 2025 to €142B by 2030 (≈12.9% CAGR), with D2C’s share of total e-commerce expanding from ~19% to ~30%. Growth is fueled by first-party data compounding (higher match rates, richer propensity models), and CRM-led monetization that decouples revenue from volatile auction CPMs. Two structural tailwinds matter. First, retail media and creator/affiliate ecosystems provide incremental reach at lower CAC variance, especially when paired with MMM and geo-lift testing. Second, service-level rationalization prioritizing “fast enough” over “fastest” unlocks fulfillment savings without meaningful conversion drag beyond threshold SLAs. On the revenue side, AOV support comes from smarter bundling (add-ons, cross-category curation), price fences, and contribution-aware promotions. On cost lines, packaging right-sizing, zonal warehousing, and micro-fulfillment near dense postcodes reduce handling and last-mile kilometers. Returns decline as product pages integrate fit/size tools and richer UGC. D2C share expansion is most pronounced in categories with strong brand preference and replenishment (beauty, wellness, pet care), while specialty apparel benefits from better size guidance and post-purchase flows. The long-term constraint remains logistics wage inflation and urban congestion charges; however, density planning and OOH pickup adoption offset part of the pressure. Net: the channel exits 2030 with demonstrably higher contribution margins and more resilient demand capture than in the 2020–2023 period.

The modeled CAC profile shows blended rates easing from ~€48 to ~€41 by 2030, with the steepest improvements in Meta/IG (creative iteration, short-form video testing), influencers (contract standardization, pay-for-performance), and e-mail/CRM (incremental wins from reactivation and win-back sequences). Google remains relatively high due to brand bidding and competitive generics, though MMM reveals pockets of positive incrementality in mid-funnel search. Affiliates sustain low volatility and favorable payback windows when guardrails prevent cannibalization of organic/branded traffic. The biggest driver of CAC discipline isn’t channel substitution alone—it’s creative ops: concept sprints, modular templates, and statistical holdouts that retire under-performing iterations quickly. We also see gains from landing-page velocity (TTFB/CDN), checkout friction removal (wallets, address-autocomplete), and zero-party data capture that drives personalized follow-ups. Crucially, D2C leaders attach CAC targets to contribution margin, not revenue, enabling smarter promo depth and shipping subsidies. This reframing prevents “cheap growth” traps where variable costs erase payback. By 2030, CAC variance narrows, enabling steadier media pacing and healthier cash cycles.

Three currents define 2025–2030. First, contribution-margin governance: brands gate discounts and shipping incentives behind SKU-level profit rules and enforce minimum CM by cohort. Second, logistics modularity: multi-node inventory blended with OOH pickup improves delivery density and lowers WISMO contacts, allowing a ~20% fulfillment cost reduction. Third, returns prevention: fit tech, 360° imagery, and pre-purchase Q&A reduce returns ~3.5 pp, with measurable savings in reverse logistics and refurbishing. Complementary trends include: (i) subscription primitives (refill calendars, member pricing, “skip/pause”) that lift LTV without heavy promos; (ii) retail media and creator marketplaces that diversify acquisition and insulate CAC; (iii) consented data expansion through quizzes and on-site tools that improve matching and lifecycle triggers; (iv) service-level realism (48-hour as default) that protects margin while keeping conversion stable; and (v) generative creative ops that multiply testing velocity. Risk factors: wage/fuel inflation in last-mile, stricter packaging/ESG rules, and signal loss in ad platforms—though MMM and server-side tagging partially offset. Net result: steadier payback and better EBITDA conversion from like-for-like revenue.
Performance bifurcates by category and customer segment. Beauty/personal care leads on gross margin and replenishment; top operators push contribution margins 400–700 bps above apparel via bundles and sampling. Specialty apparel improves profitability as size/fit tech slashes return risk among first-time buyers; VIP tiers and member-only drops sustain repeat rates. Home & lifestyle excels on basket composition (attach rate of accessories and care SKUs), though bulky shipping requires packaging right-sizing to avoid cost blow-outs. Health & wellness subscriptions (e.g., nutraceuticals) convert at higher LTV/CAC with churn inhibitors like cadence control and expert content. By customer segment, high-intent, content-engaged cohorts (email-captured, quiz-based) deliver 20–35% higher 6-month LTV than paid-social cold traffic. Geography-wise, DACH and UK&I anchor absolute revenue; Nordics and Benelux outperform on AOV and membership penetration; Southern Europe and CEE post faster growth from a smaller base. B2B2C (wholesale via marketplaces) remains a secondary lever for inventory turns, but true margin lift stems from D2C where brands control pricing, packaging, and experience.
By 2030, we model D2C GMV distribution as: DACH (~22%), UK & Ireland (~19%), France (~17%), Southern Europe (~16%), Nordics (~10%), Benelux (~8%), and CEE (~8%). DACH benefits from high online penetration and operational rigor (multi-node networks, parcel lockers), while the UK leverages mature retail media ecosystems and high wallet adoption for friction-light checkout. France sustains balanced growth through strong national brands and a tightening of returns policies that protect margins. Southern Europe’s share rises on logistics modernization (regional hubs, OOH pickup) and social-commerce adoption; CEE’s growth outpaces the average but off a smaller base, helped by cross-border enablement and improving payments coverage. Nordics and Benelux punch above their weight in AOV and subscription uptake, aided by high trust in locker networks and strong digital ID/wallet penetration. For network planning, brands should stage expansion by combining demand-density maps with carrier SLAs and pickup-point coverage, then phase inventory nodes as cohorts mature. Contribution-aware regional pricing (VAT, duties, fuel surcharges) remains essential to maintain target margins.

The competitive frontier rewards operating-model excellence more than storytelling. Leaders share traits: a clear CAC stack (channel incrementality + creative testing cadence), contribution-margin guardrails embedded in promo and shipping logic, and modular fulfillment with OOH options to stabilize last-mile costs. They maintain disciplined SKU architectures (few, high-contribution hero SKUs + curated add-ons) and lean into memberships to monetize loyalty without permanent discounting. Challenger brands win by niching into high-affinity communities and exploiting creator collaborations with transparent rev-share. Aggregators/platforms continue to provide low-capex scale but compress brand margins; hence, hybrid strategies keep a D2C core for data/experience while using marketplaces tactically for new-to-brand reach and inventory turns. Enablers (3PLs, lockers, retail media networks, creator marketplaces, payments wallets, returns tech) co-evolve to offer tighter SLAs and better attribution, lowering CAC variance and cost-to-serve. M&A likely centers on capability buys (creative ops, data, logistics tech) rather than pure brand roll-ups. The durable advantage: a closed-loop system where product, media, pricing, and logistics are governed by contribution margin and cohort LTV—not vanity growth.