

68 Circular Road, #02-01 049422, Singapore
Revenue Tower, Scbd, Jakarta 12190, Indonesia
4th Floor, Pinnacle Business Park, Andheri East, Mumbai, 400093
Cinnabar Hills, Embassy Golf Links Business Park, Bengaluru, Karnataka 560071


Connect With Us


68 Circular Road, #02-01 049422, Singapore
Revenue Tower, Scbd, Jakarta 12190, Indonesia
4th Floor, Pinnacle Business Park, Andheri East, Mumbai, 400093
Cinnabar Hills, Embassy Golf Links Business Park, Bengaluru, Karnataka 560071
Connect With Us
68 Circular Road, #02-01 049422, Singapore
Revenue Tower, Scbd, Jakarta 12190, Indonesia
4th Floor, Pinnacle Business Park, Andheri East, Mumbai, 400093
Cinnabar Hills, Embassy Golf Links Business Park, Bengaluru, Karnataka 560071
Request Custom Transcript
Industrial Heat Pump End Use: High-Temperature Applications & Refrigerant Innovations
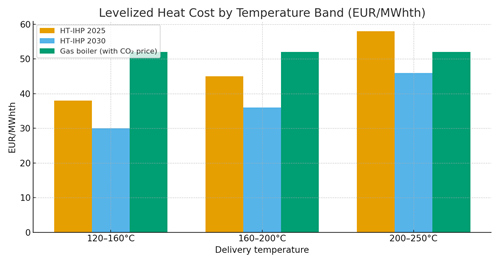
From 2025 to 2030, high‑temperature industrial heat pumps (HT‑IHPs) scale across Europe, with Denmark setting the pace through power‑to‑heat economics, district energy integration, and mature EPC/O&M capabilities. HT‑IHPs delivering 120–200 °C and niche cascades reaching ~250 °C replace gas and fuel‑oil boilers in pasteurization, drying, washing, distillation, and low‑pressure steam preheating. The business case hinges on electricity‑to‑gas spreads (incl. carbon), integration quality (pinch analysis, return temperatures, cascade options), and refrigerant/compressor choices that keep COP ≥2.0 at high lifts. Denmark leads due to high RES shares and flexible market design; Sweden, the Netherlands, Austria and Germany follow, prioritizing sites with waste‑heat (20–60 °C) and high operating hours. Illustrative levelized heat costs (LHC) fall from ~€38/MWhth at 120–160 °C in 2025 to ~€30/MWhth by 2030; at 200–250 °C, optimization trims LHC from ~€58 to ~€46, challenging gas boilers once carbon exceeds €80–100/tCO₂ and PPAs or time‑of‑use optimization are in place. While electrical interconnection remains a gating item, modular skids and digital controls shorten lead times.

What's Covered?
Report Summary
Key Takeaways
1) HT‑IHPs widely cover 120–200 °C; 200–250 °C via cascades.
2) Denmark leads Europe on power‑to‑heat economics and district coupling.
3) By 2030, HT‑IHP LHC undercuts gas at carbon ≥€80–100/t with ToU/PPAs.
4) Natural refrigerants win share for compliance, safety, efficiency.
5) Process integration (pinch/cascade) beats like‑for‑like boiler swaps.
6) Digital dispatch vs ToU prices yields 5–10% savings.
7) Standardized skids cut install time and capex risk.
8) Outcome‑based SLAs (availability, COP) improve bankability.
Key Metrics

Market Size & Share
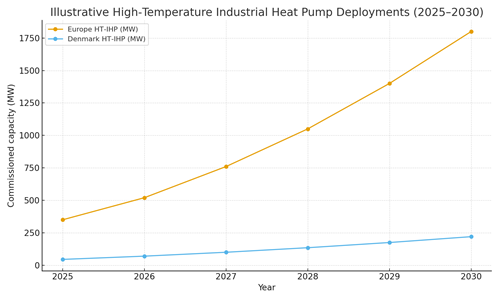
Europe’s HT‑IHP market scales from ~350 MW in 2025 to ~1.8 GW by 2030 in this illustrative outlook, with Denmark rising from ~45 MW to ~220 MW through repeatable district‑energy and food‑processing projects. Share accrues to vendors offering modular cascades, high‑lift compression, and robust service. Industrial campuses adopt hybrid layouts where HT‑IHPs preheat returns and reduce steam demand, improving abatement per euro invested. Northern and Benelux regions expand fastest thanks to high RES penetration and supportive policies; Central/Southern Europe follows as PPAs and self‑generation lower electricity costs.
Market Analysis
Competitiveness improves across all temperature bands. At 120–160 °C, LHC falls from ~€38 to ~€30/MWhth as COP rises and capex normalizes. At 160–200 °C, LHC drops from ~€45 to ~€36. At 200–250 °C, cascades and improved heat exchange trim LHC from ~€58 to ~€46, narrowing the gap with gas boilers priced ~€52/MWhth when carbon is internalized. Process integration is decisive: 10 K lower lift can raise COP ~4–6%, and 20–40 °C waste‑heat recovery can cut LHC by €4–7/MWhth. Riskspower price volatility, MV interconnection delays, skilled‑labor scarcity for NH₃/R290—are mitigated via PPAs/hedges, early grid studies, and training.
Trends & Insights (2025–2030)
• Natural refrigerants mainstream; blends remain where flammability/toxicity constraints dominate.
• Variable‑speed screws/centrifugals with ejectors boost high‑lift efficiency.
• Thermal storage + MPC dispatch optimize ToU arbitrage and COP.
• Prefab skids standardize BOP and shorten commissioning.
• Stronger F‑gas limits and ETS pricing shift TCO toward electrification.
• Broader applications: dryers, reboilers, paper hoods, breweries at 150–220 °C.
Segment Analysis
Food & beverage leads near‑term volume; pulp & paper gains with hood and condensate preheat; chemicals deploy for reboilers up to ~200 °C; district energy and industrial parks integrate large NH₃ units; textiles adopt for dryers with strict safety controls. Buyers should anchor programs in heat‑mapping and pinch analysis, specify COP and availability KPIs, and adopt performance‑linked SLAs and multi‑site frameworks for scale benefits.
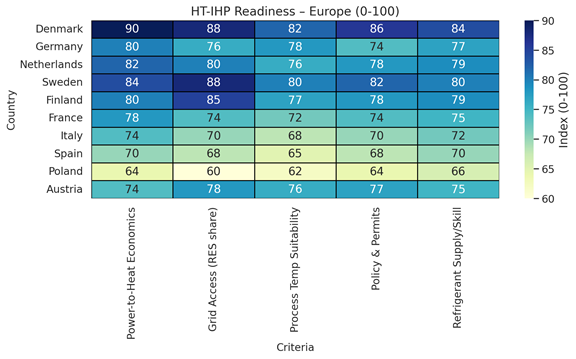
Geography Analysis (Denmark & Europe)
Denmark remains frontrunner owing to market design and skills; Sweden/Finland excel on RES grid mix; NL/DE scale through industrial clusters; Austria fast‑follows via district heating. Italy/Spain compete where PPAs offset power price volatility; Poland requires stronger grid access and carbon signals. Workforce training for NH₃/R290 safety is a cross‑Europe need as natural refrigerants gain share.
Competitive Landscape (Ecosystem & Delivery Models)
Competition centers on high‑lift efficiency, refrigerant flexibility, controls, and service depth. Integrators providing turnkey EPC+O&M and outcome‑based contracts win bankability. As portfolios grow, financing links to verified abatement and COP. Vendor ecosystems across Nordics/Benelux accelerate deployment through common standards, training, and spares pools; leaders pair engineering depth with rapid, repeatable delivery.
Report Details
Proceed To Buy
Want a More Customized Experience?
- Request a Customized Transcript: Submit your own questions or specify changes. We’ll conduct a new call with the industry expert, covering both the original and your additional questions. You’ll receive an updated report for a small fee over the standard price.
- Request a Direct Call with the Expert: If you prefer a live conversation, we can facilitate a call between you and the expert. After the call, you’ll get the full recording, a verbatim transcript, and continued platform access to query the content and more.
68 Circular Road, #02-01 049422, Singapore
Revenue Tower, Scbd, Jakarta 12190, Indonesia
4th Floor, Pinnacle Business Park, Andheri East, Mumbai, 400093
Cinnabar Hills, Embassy Golf Links Business Park, Bengaluru, Karnataka 560071
Request Custom Transcript
Related Transcripts


68 Circular Road, #02-01 049422, Singapore
Revenue Tower, Scbd, No.52-53, Jakarta 12190, Indonesia
Cinnabar Hills, Embassy Golf Links Business Park, Bengaluru, Karnataka 560071
4th Floor, Pinnacle Business Park, Andheri East, Mumbai, 400093


68 Circular Road, #02-01 049422, Singapore
Revenue Tower, Scbd, Jakarta 12190, Indonesia
4th Floor, Pinnacle Business Park, Andheri East, Mumbai, 400093
Cinnabar Hills, Embassy Golf Links Business Park, Bengaluru, Karnataka 560071