

68 Circular Road, #02-01 049422, Singapore
Revenue Tower, Scbd, Jakarta 12190, Indonesia
4th Floor, Pinnacle Business Park, Andheri East, Mumbai, 400093
Cinnabar Hills, Embassy Golf Links Business Park, Bengaluru, Karnataka 560071


Connect With Us


68 Circular Road, #02-01 049422, Singapore
Revenue Tower, Scbd, Jakarta 12190, Indonesia
4th Floor, Pinnacle Business Park, Andheri East, Mumbai, 400093
Cinnabar Hills, Embassy Golf Links Business Park, Bengaluru, Karnataka 560071
Connect With Us
68 Circular Road, #02-01 049422, Singapore
Revenue Tower, Scbd, Jakarta 12190, Indonesia
4th Floor, Pinnacle Business Park, Andheri East, Mumbai, 400093
Cinnabar Hills, Embassy Golf Links Business Park, Bengaluru, Karnataka 560071
Request Custom Transcript
EU Green Hydrogen Production Cost Analysis: Electrolyzer Tech & Subsidy Impacts
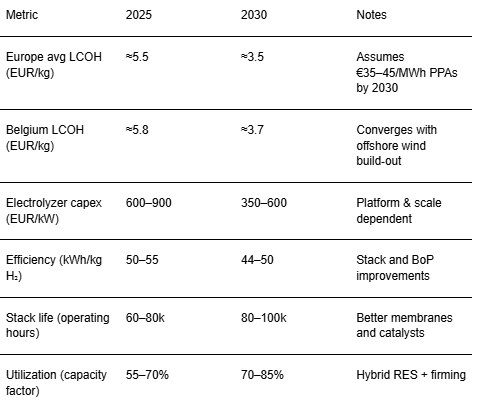
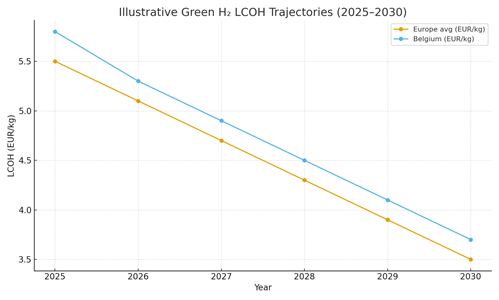
Between 2025 and 2030, Europe’s green‑hydrogen costs decline as electrolyzer capex falls, stacks last longer, and renewable PPAs expand. Belgium sits at the heart of this shift, leveraging access to North Sea wind, industrial off‑takers in chemicals and refining, and cross‑border infrastructure to import/export green molecules and derivatives. Production economics remain dominated by electricity price and capacity factor; policy support contracts for difference (CfDs), investment grants, grid‑fee relief, and guarantees of origin shapes bankability and brings levelized cost of hydrogen (LCOH) inside industrial switching thresholds. Illustrative trajectories suggest Europe’s average LCOH could move from ~€5.5/kg in 2025 toward ~€3.5/kg in 2030 under favorable PPAs (≤€35–45/MWh), 70–80% utilization via hybrid RES portfolios or grid‑firming, and a 30–40% decline in electrolyzer capex. Belgium tracks slightly above the EU average in early years due to system integration and grid charges, converging by 2030 as offshore wind volumes and support mechanisms mature. The cost stack shifts from capex‑heavy to power‑driven, keeping power procurement strategy central to project value.

What's Covered?
Report Summary
Key Takeaways
1) Electricity cost and utilization dominate LCOH PPA structure is the primary value lever.
2) Electrolyzer capex declines 30–40% by 2030; stack life and efficiency gains reduce OPEX.
3) Belgium’s costs converge with EU average as offshore wind and grid relief mature.
4) PEM excels for dynamic loads; alkaline for capex; SOEC/AEM offer niche efficiency plays.
5) Hybrid RES portfolios and DC‑coupled designs stabilize load and cut grid fees.
6) CfDs, investment aid, and tariff exemptions compress LCOH dispersion across the EU.
7) Modular skids and predictive maintenance improve availability and shorten outages.
8) Bankable MRV for GoOs/renewable H₂ claims unlocks premium offtake in chemicals/fuels.
Key Metrics
Market Size & Share
Green hydrogen’s addressable market in Europe scales with industrial switching (ammonia, methanol, refineries, steel) and cross‑border logistics. Cost competitiveness hinges on falling LCOH trajectories driven by lower power prices and improved capacity factors. Our illustrative paths show Europe’s average LCOH moving from ~€5.5/kg (2025) to ~€3.5/kg (2030), with Belgium tracking from ~€5.8 to ~€3.7/kg as offshore wind and interconnectors expand. Market share for early production concentrates in wind‑rich North Sea states and Iberia, with Belgium leveraging import hubs and industrial clusters. As LCOH approaches fossil‑parity thresholds for selected processes, offtake agreements indexed to power and carbon prices unlock larger FIDs and pipeline growth.
Share dynamics are influenced by (1) renewable resource quality and firming options; (2) interconnection and grid tariff regimes; (3) policy instruments like CfDs and investment grants; and (4) industrial proximity to minimize transport costs. Standardized modular islands and bankable O&M playbooks help developers replicate projects across regions, accelerating capacity build‑out.
Market Analysis
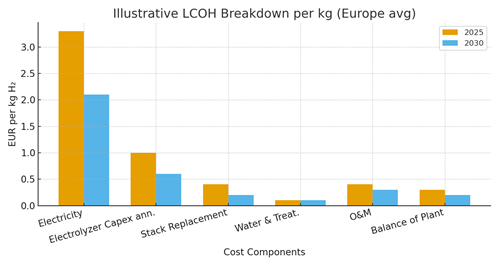
The LCOH stack is electricity‑led. In 2025, power accounts for ~€3.3/kg of a ~€5.5/kg European average, with electrolyzer capex annuitization ~€1.0/kg and stack replacement ~€0.4/kg. By 2030, efficiency gains and capex learning reduce these to ~€2.1/kg (power), ~€0.6/kg (capex), and ~€0.2/kg (stack), assuming PPAs at €35–45/MWh and capacity factors of ~75% via hybrid portfolios or grid firming. Water treatment, O&M, and balance of plant trend modestly downward with standardization and scale.
Sensitivity analysis shows power price and utilization as the dominant levers; a ±€10/MWh swing shifts LCOH by ~€0.4–0.5/kg. Grid fee exemptions and DC‑coupled architectures further lower delivered cost. Platform choice (alkaline vs PEM vs AEM/SOEC) alters capex and efficiency terms, but availability and stack life often dominate real‑world economics. Contracts should specify availability KPIs, stack warranty hours, and power‑quality tolerances.
Trends & Insights
Hybrid RES + firming: portfolios blend offshore wind with solar and limited storage to stabilize electrolyzer load. Modularization: factory‑built islands shorten commissioning and improve quality. DC coupling & power electronics: lower conversion losses and grid charges while improving ramping. Digital O&M: condition‑based stack maintenance and predictive replacement increase uptime. Policy maturation: EU tenders and national CfDs standardize support and compress cost dispersion. Certificates & MRV: granular temporal/location matching gains importance for premium offtake.
Segment Analysis
Refining & Chemicals: earliest adoption through desulfurization hydrogen and ammonia/methanol pilots. Steel & E‑fuels: scale follows as LCOH declines and CO₂ prices rise; clustering near ports and RES hubs. Mobility Hubs: niche early markets where high utilization and policy support align. Grid‑balancing Providers: electrolyzers as flexible loads in congestion management and ancillary services.
Geography Analysis
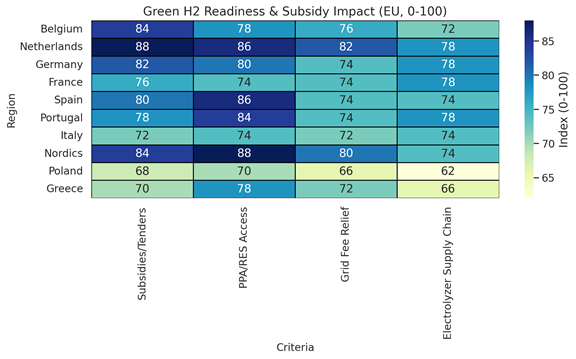
North Sea states (NL, BE, DE, Nordics) lead on readiness through offshore wind, interconnectors, and hydrogen backbones. Iberia benefits from high solar yields and available land; France and Italy progress with mixed portfolios; Poland and Greece accelerate via tenders and grid reforms. Belgium’s edge lies in industrial clustering, port infrastructure, and cross‑border logistics. Subsidy depth, grid‑fee relief, and electrolyzer supply chains together determine relative LCOH and the speed of bankable projects.
Competitive Landscape
The ecosystem spans electrolyzer OEMs (alkaline, PEM, AEM, SOEC), EPCs, renewable developers, traders, and offtakers in chemicals, fuels, and steel. Differentiation rests on power procurement capability, modular island design, availability guarantees, and MRV‑ready certificates. Partnerships between OEMs and developers create turnkey offerings with CfD integration and performance SLAs. Players that combine low‑cost PPAs, robust O&M, and credible offtake will capture outsized share in Belgium and across Europe as tenders scale.
Report Details
Proceed To Buy
Want a More Customized Experience?
- Request a Customized Transcript: Submit your own questions or specify changes. We’ll conduct a new call with the industry expert, covering both the original and your additional questions. You’ll receive an updated report for a small fee over the standard price.
- Request a Direct Call with the Expert: If you prefer a live conversation, we can facilitate a call between you and the expert. After the call, you’ll get the full recording, a verbatim transcript, and continued platform access to query the content and more.
68 Circular Road, #02-01 049422, Singapore
Revenue Tower, Scbd, Jakarta 12190, Indonesia
4th Floor, Pinnacle Business Park, Andheri East, Mumbai, 400093
Cinnabar Hills, Embassy Golf Links Business Park, Bengaluru, Karnataka 560071
Request Custom Transcript
Related Transcripts


68 Circular Road, #02-01 049422, Singapore
Revenue Tower, Scbd, No.52-53, Jakarta 12190, Indonesia
Cinnabar Hills, Embassy Golf Links Business Park, Bengaluru, Karnataka 560071
4th Floor, Pinnacle Business Park, Andheri East, Mumbai, 400093


68 Circular Road, #02-01 049422, Singapore
Revenue Tower, Scbd, Jakarta 12190, Indonesia
4th Floor, Pinnacle Business Park, Andheri East, Mumbai, 400093
Cinnabar Hills, Embassy Golf Links Business Park, Bengaluru, Karnataka 560071