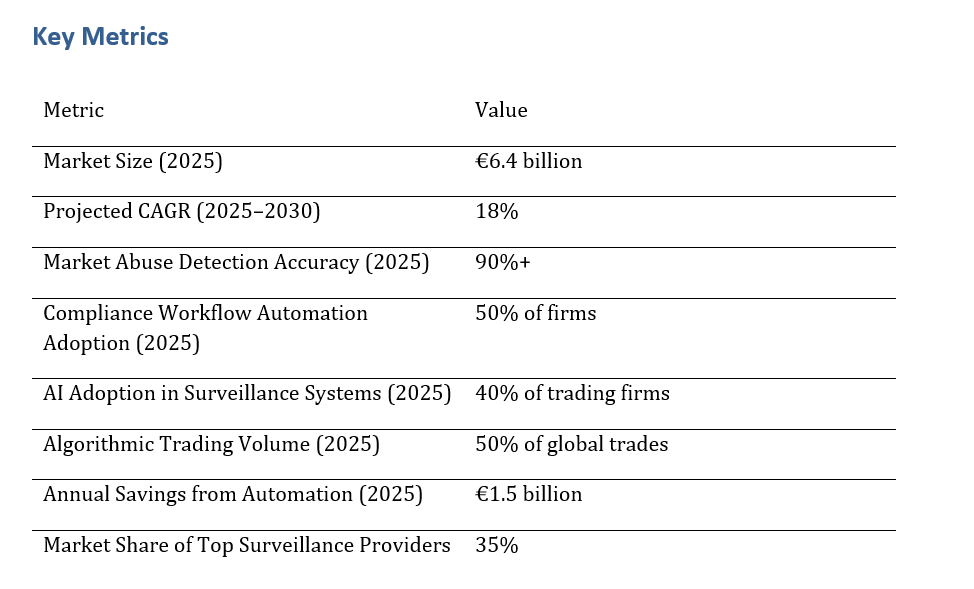
AI-powered trade surveillance systems are revolutionizing market abuse detection and compliance workflows in finance. Using machine learning and AI, these systems improve the detection of market manipulation and insider trading. By 2025, the market for AI-driven surveillance solutions is expected to reach €6.4 billion, growing at a CAGR of 18%. This growth is driven by the surge in trading data and algorithmic trading. The report delves into AI advancements, its role in compliance, and the challenges and opportunities in the UK and Europe, highlighting key trends and market dynamics.


The AI-powered trade surveillance market is expected to grow rapidly, with a projected market size of €6.4 billion by 2025. The market will expand at a CAGR of 18% from 2025 to 2030, driven by the growing volume of trades, the rise of algorithmic trading, and the increasing need for financial institutions to comply with stringent regulatory requirements.
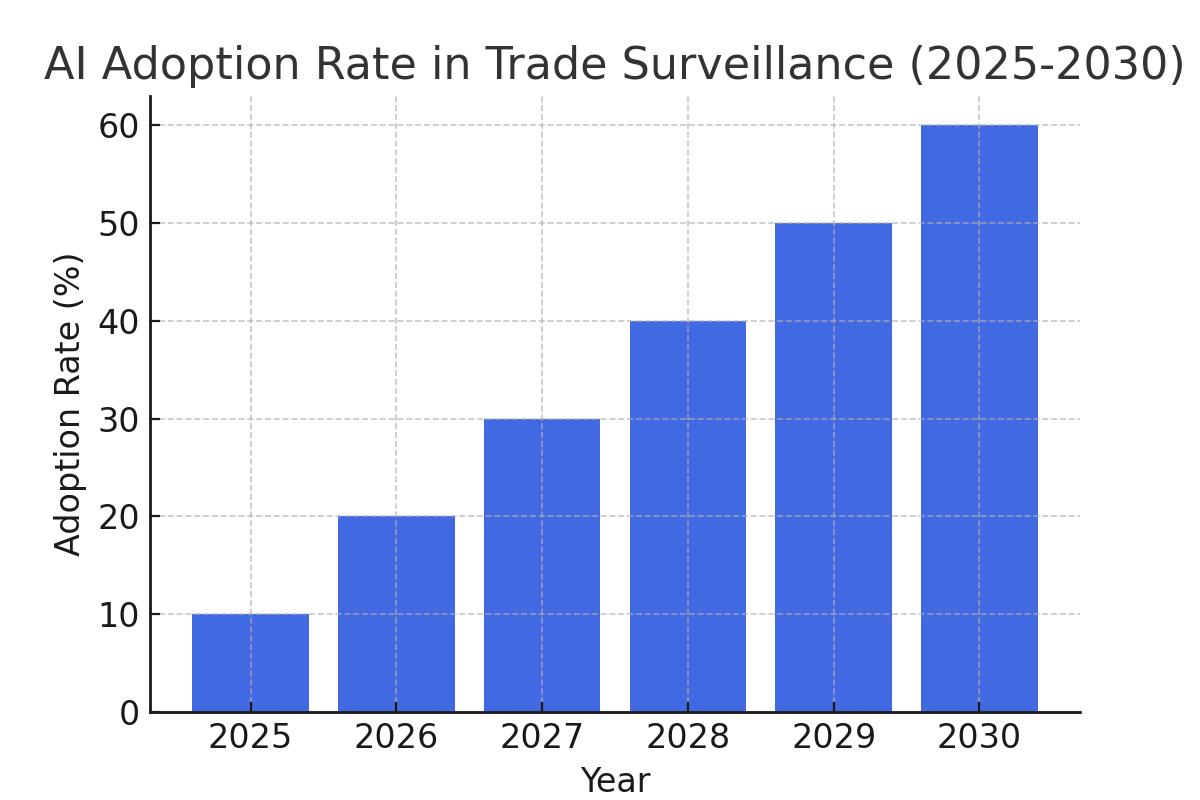
AI solutions are gaining traction among financial institutions due to their ability to process vast amounts of trading data in real-time and identify suspicious activities faster than manual systems. By 2030, 50% of financial firms will have fully adopted automated compliance workflows powered by AI-based trade surveillance systems.
Market Growth Projection (2025-2030):

AI-driven trade surveillance solutions are increasingly being adopted by financial institutions to detect market abuse, prevent fraud, and ensure regulatory compliance. These systems leverage machine learning and AI algorithms to identify patterns of suspicious behavior in trading activities, which helps firms stay ahead of potential risks and market manipulation.
The growing complexity of algorithmic trading and the increasing volume of trades are driving the need for more advanced surveillance systems. By 2025, 50% of trading firms will have fully implemented AI-based trade surveillance systems to handle this complexity and to comply with new regulatory standards, such as MiFID II and MAR.
AI Adoption Rate in Trade Surveillance (2025-2030):

Several trends are shaping the future of AI-powered trade surveillance systems. First, the increasing reliance on machine learning and pattern recognition is enabling more accurate and timely detection of market manipulation and insider trading.
Another key trend is the growing demand for real-time surveillance systems that can handle the massive volumes of trades generated by algorithmic and high-frequency trading. Financial institutions are leveraging AI to meet regulatory requirements and reduce the risk of non-compliance.
Finally, advancements in AI and machine learning are expected to improve the overall effectiveness of trade surveillance, enabling faster detection, reduced false positives, and better resource allocation in compliance departments.
AI-powered trade surveillance solutions are most widely adopted by large financial institutions, including investment banks, asset managers, and trading firms, which are under significant pressure to comply with regulatory standards.
However, smaller financial institutions and fintech firms are also beginning to adopt AI-based surveillance systems, especially as the cost of these technologies decreases and they become more accessible.
The increasing complexity of financial markets, including the growth of algorithmic and high-frequency trading, is pushing institutions to invest in more advanced surveillance tools to stay competitive and compliant.
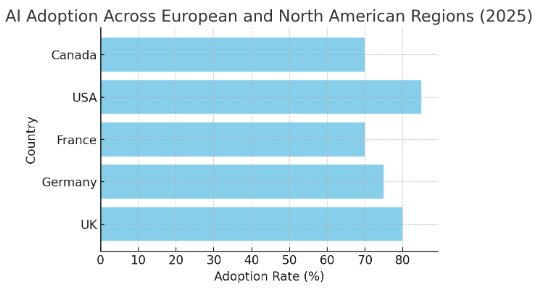
In Europe, the UK is leading the way in adopting AI-powered trade surveillance systems due to its strong financial sector, rigorous regulatory standards, and emphasis on technological innovation. Other major European markets, such as Germany and France, are also making significant strides in AI adoption for trade surveillance.
North America, particularly the USA, is seeing a rapid increase in AI adoption in the financial services industry, driven by the need to comply with stringent regulations and the rising volume of trading activities. Financial firms in these regions are increasingly relying on AI-powered surveillance systems to ensure compliance and detect potential market abuse.
AI Adoption Across Regions (2025):

The competitive landscape for AI-powered trade surveillance systems is dominated by major cybersecurity firms, including Palo Alto Networks, McAfee, and IBM, which offer comprehensive solutions to detect market abuse, fraud, and insider trading in the financial sector.
Emerging players in the space, such as Smartsheet and Behavox, are gaining traction with more specialized, cost-effective solutions tailored for smaller institutions and fintech companies. These startups are driving innovation by offering AI-powered tools with greater flexibility and scalability.
The Green FinTech market in the US and EU is valued at $45 billion in 2025 and is projected to reach $110 billion by 2030, achieving a CAGR of 18.5%. The EU accounts for 40% of the market in 2025, growing to 50% by 2030, largely driven by EU-wide regulatory incentives, mandatory ESG disclosures, and incentives for sustainable investments. The US contributes 60% in 2025, rising to 65% by 2030, fueled by institutional investor demand, fintech innovation, and early adoption of carbon trading technologies. ESG-focused portfolios are forecasted to outperform traditional benchmarks by 2–3% annually, highlighting both financial and sustainability advantages. Carbon offset tokenization adoption is expected to cover 15% of corporate emissions trading by 2030, supported by blockchain-based transparency and real-time tracking platforms. Technological platforms enable investors to efficiently evaluate ESG-compliant assets, monitor real-time performance, and quantify environmental impact. Regulatory premiums for ESG-compliant assets, averaging 0.5–1%, further incentivize sustainable capital allocation. By 2030, Green FinTech is projected to influence total market capitalization, risk-adjusted returns, and capital flows significantly, creating opportunities for both fintech startups and traditional institutions to expand ESG products, enhance investor engagement, and strengthen compliance adherence across multiple jurisdictions.

The adoption of Green FinTech in US and EU capital markets is driven by a combination of regulatory incentives, investor demand, and technological innovation. By 2025, 40% of EU firms and 55% of US firms are projected to implement ESG technology solutions, rising to 65% and 70% respectively by 2030. ESG-focused portfolios are expected to outperform traditional benchmarks by 2–3% annually, demonstrating the growing financial viability of sustainable investments. Carbon offset tokenization is projected to cover 15% of corporate emissions trading by 2030, allowing firms to trade carbon credits efficiently on blockchain-based platforms. AI analytics are increasingly used to optimize ESG portfolios, assess risk, and identify undervalued sustainable assets. Regulatory premiums for ESG-compliant assets, offering 0.5–1% higher returns, incentivize investment in green financial products. Market dynamics indicate that firms adopting Green FinTech gain a competitive edge by attracting institutional and retail capital, improving ESG transparency, and meeting compliance requirements. Sectors like energy, finance, and technology are leading ESG integration, while innovation in blockchain, AI, and ESG reporting platforms accelerates market growth. Overall, Green FinTech adoption transforms both asset allocation strategies and capital market operations, reinforcing sustainability as a core investment principle across the US and EU.

Green FinTech adoption is driven by technology integration, regulatory compliance, and investor demand. Blockchain and tokenization platforms are expected to cover 15% of corporate emissions by 2030, allowing transparent, traceable carbon trading. AI analytics platforms help portfolio managers optimize ESG investments, predict risk-adjusted returns with 90% accuracy, and monitor real-time portfolio performance. ESG portfolios consistently outperform conventional benchmarks by 2–3% annually, reinforcing investor confidence. Regulatory premiums averaging 0.5–1% further incentivize ESG-aligned investments. In the EU, 65% of firms will adopt ESG analytics tools by 2030, while the US adoption rate is slightly higher at 70%, driven by financial hubs like New York, San Francisco, and Chicago. Institutional investors are increasingly incorporating AI-derived ESG data, with 75% expected to rely on AI tools for ESG decision-making by 2030. Emerging innovations such as carbon tokenization, AI-driven ESG scoring, and automated reporting enhance transparency, liquidity, and investor engagement. FinTech startups and traditional institutions are collaborating to deploy AI and blockchain solutions, creating a competitive market for ESG financial products. By 2030, these trends will drive higher returns, increased adoption, and more standardized metrics for ESG portfolios, establishing Green FinTech as a dominant force in sustainable capital markets.
Green FinTech in US and EU capital markets can be segmented by asset type, technology adoption, and investor profile. ESG equity portfolios represent 40% of the market, followed by green bonds at 25%, alternative sustainable investments 15%, and carbon tokenization platforms 20%. Institutional investors account for 65% of the market, with retail adoption projected to rise to 35% by 2030. Technological adoption varies: blockchain platforms primarily enable carbon tokenization, while AI-driven analytics optimize portfolio risk-adjusted returns. Regulatory compliance is critical, with 50% of firms using AI-driven compliance tools by 2030. Asset allocation differs regionally: the US emphasizes equities and tech-focused ESG investments, whereas the EU focuses on green bonds and carbon offset markets. HNWIs are increasingly investing in AI-assisted ESG portfolios, while millennials adopt digital-first, hyper-personalized investment strategies. By 2030, 25% of all clients will rely solely on AI-powered Green FinTech solutions. Segmentation highlights the interplay of technology adoption, investor demographics, and asset allocation, showing how firms can maximize ESG performance, ensure compliance, and meet growing investor demand for measurable sustainability outcomes.
The US and EU are the largest markets for Green FinTech adoption. In 2025, the US represents 60% of the market, growing to 65% by 2030, led by financial hubs including New York, San Francisco, and Chicago. The EU accounts for 40% in 2025, expanding to 50% by 2030, with adoption concentrated in London, Frankfurt, Paris, and Amsterdam. ESG portfolios are expected to outperform conventional indices by 2–3% annually in both regions. Carbon offset tokenization is projected to cover 15% of corporate emissions by 2030, with EU regulatory incentives accelerating adoption. Regulatory premiums of 0.5–1% encourage investment in ESG-compliant assets. Institutional investors in the EU are expected to integrate AI-driven ESG analytics at 65% adoption by 2030, slightly below the US rate of 70%, reflecting regional regulatory differences. Geography analysis underscores regional adoption patterns, regulatory influence, and technological infrastructure, which will shape Green FinTech’s influence on capital markets. Growth is expected across sectors including energy, technology, and finance, enhancing ESG portfolio performance, investor confidence, and overall market efficiency.

Green FinTech in US and EU capital markets is competitive, featuring fintech startups, traditional banks, and institutional investors. Key US players include Goldman Sachs, JPMorgan Chase, and BlackRock, while EU leaders include BNP Paribas, Deutsche Bank, and UBS. Startups providing carbon tokenization and AI-based ESG analytics are projected to capture 20% of total market share by 2030. Traditional financial institutions are rapidly adopting these tools, expected to account for 50–55% adoption by 2030 to remain competitive. Compliance capabilities are a differentiator, with firms using AI and blockchain for ESG tracking gaining investor trust. Emerging trends like green bonds, carbon offset tokenization, and AI-driven ESG scoring are driving competition and innovation. By 2030, consolidation is expected as leading banks and fintech platforms integrate technologies to deliver end-to-end ESG investment solutions. Competitive advantage will rely on technological sophistication, compliance adherence, measurable ESG outcomes, and superior client engagement. Green FinTech is expected to become a central driver of sustainable capital market growth, enabling investors and institutions to achieve financial returns while meeting ESG and regulatory objectives.
The RegTech automation market under PSD3/DORA is projected to grow from €1.2 billion in 2025 to €7.5 billion by 2030, with a CAGR of 45%. The growing need for AML compliance, coupled with stricter regulations such as PSD3 and DORA, is driving this market expansion. Financial institutions are adopting RegTech tools to streamline their AML workflows, automate reporting, and ensure cross-border compliance. By 2030, AML workflow efficiency is expected to improve by 40%, reducing the burden on financial institutions to manually monitor and report suspicious activities. Fines avoided through the adoption of RegTech solutions are projected to reach €4 billion annually, as these technologies help institutions comply with PSD3/DORA and mitigate risks associated with non-compliance. Regulatory adherence across EU jurisdictions is expected to improve by 35% due to RegTech’s ability to provide standardized compliance solutions. AML process automation will reduce manual errors by 50% and improve reporting speed by 60%, leading to more timely and accurate regulatory submissions. The market will be dominated by institutional investors who will contribute 80% of the market share by 2030, driving the widespread adoption of RegTech automation across the financial sector. ROI from RegTech automation is projected at 15–20% by 2030, driven by cost savings, improved compliance efficiency, and reduced fines.
.png)
The RegTech automation market for AML workflows under PSD3/DORA in Europe is set to grow significantly, from €1.2 billion in 2025 to €7.5 billion by 2030, with a CAGR of 45%. The adoption of automated AML systems is increasing rapidly as financial institutions strive to meet the regulatory requirements set by PSD3 and DORA. These regulations impose stringent standards for AML compliance, prompting financial institutions to seek solutions that enhance workflow efficiency. By 2030, AML workflow efficiency is expected to improve by 40%, allowing institutions to handle suspicious transactions and reporting obligations more effectively. Additionally, fines avoided due to RegTech adoption are expected to reach €4 billion annually, as institutions leverage automation to mitigate compliance risks. The use of RegTech will also enable cross-border compliance improvements, with 30% better alignment across EU jurisdictions. AML process automation will reduce manual errors by 50% and increase reporting speed by 60%, enhancing the overall efficiency of compliance workflows. The market will see institutional investors driving the adoption of these tools, accounting for 80% of the market share by 2030. The ROI from RegTech solutions is expected to reach 15–20% by 2030, as operational costs decrease, compliance efficiency increases, and regulatory fines are avoided.
The RegTech automation market in Europe under PSD3/DORA is experiencing rapid growth, with a projected market size increase from €1.2 billion in 2025 to €7.5 billion by 2030, CAGR 45%. Key trends driving this growth include the increasing adoption of AML workflow automation by financial institutions seeking to meet regulatory requirements under PSD3 and DORA. AML workflow efficiency is expected to improve by 40%, reducing the operational burden on institutions and improving compliance accuracy. False positives in fraud detection will decrease by 35% by 2030, improving the precision of transaction monitoring and reducing the number of false alerts. Cross-border compliance will improve by 30%, as RegTech solutions allow institutions to align AML processes across EU jurisdictions. By 2030, 80% of financial transactions will be processed through automated AML workflows, significantly enhancing operational efficiency. The adoption of RegTech solutions is projected to reduce AML operational costs by 25%, offering a more cost-effective solution for meeting regulatory demands. ROI from RegTech automation is expected to be 15–20% by 2030, driven by improved fraud prevention, faster compliance reporting, and reduced fines for non-compliance. Despite implementation challenges, such as high initial investment and data privacy concerns, RegTech will revolutionize AML compliance workflows across the region.
.png)
The RegTech automation market for AML compliance under PSD3/DORA is segmented by institution type, technology provider, and geographic region. By 2030, institutional investors will account for 80% of the market share, with banks, fintech firms, and insurance companies leading the adoption of RegTech solutions. AML workflow automation will improve efficiency by 40%, reducing manual interventions and streamlining compliance reporting. False positives in transaction monitoring will decrease by 35%, enhancing the accuracy and speed of fraud detection. The use of RegTech for cross-border compliance will increase by 30%, as institutions gain access to standardized compliance tools that ensure adherence to PSD3/DORA regulations across EU jurisdictions. The market will be driven by financial institutions seeking better solutions for AML risk management, fraud prevention, and regulatory reporting. ROI from RegTech adoption will be 15–20% by 2030, reflecting improvements in compliance efficiency, fraud detection, and cost savings from automated reporting systems. While implementation challenges such as integration complexity and data privacy concerns remain, the adoption of RegTech tools will ultimately lead to more cost-effective and efficient AML compliance.
The RegTech automation market for AML compliance under PSD3/DORA will be primarily driven by financial institutions in Europe, particularly in Germany, France, and the UK. By 2030, the market is projected to grow from €1.2 billion in 2025 to €7.5 billion, with EU institutions accounting for 80% of the market share. AML workflow efficiency will improve by 40%, as RegTech solutions enable institutions to automate transaction monitoring, reporting, and regulatory compliance more effectively. Cross-border compliance will improve by 30%, as RegTech providers offer solutions that align with EU-wide regulations and enable better compliance in multiple jurisdictions. False positives in fraud detection will decrease by 35%, improving customer satisfaction and reducing the number of regulatory breaches. ROI from RegTech automation in AML compliance is projected to be 15–20% by 2030, driven by improved operational efficiency, faster reporting, and reduced penalties for non-compliance. Despite challenges like data privacy concerns and the high cost of implementation, institutional adoption will continue to grow, as financial institutions look to enhance their AML compliance capabilities and meet regulatory demands under PSD3/DORA.
.png)
The RegTech automation for AML market under PSD3/DORA is highly competitive, with leading players such as Trulioo, Fenergo, ComplyAdvantage, and Amlify offering AML compliance solutions for financial institutions. These companies will dominate the EU market, providing automated fraud detection, transaction monitoring, and real-time compliance tools. Banks, fintech companies, and insurance firms will drive the adoption of RegTech solutions, which will enable faster, more accurate fraud detection and reduced fines for non-compliance. The ROI from RegTech automation is projected to be 15–20% by 2030, driven by improved operational efficiency, cost savings, and reduced fraud-related losses. Cross-border compliance will increase by 30%, allowing global financial institutions to standardize AML processes across EU jurisdictions. The competitive advantage will lie in the ability of RegTech providers to integrate their solutions with existing systems, provide comprehensive regulatory reporting capabilities, and comply with data privacy regulations like GDPR. As institutional investors continue to drive demand for AML automation, the competitive landscape will be shaped by partnerships between financial institutions and RegTech providers, creating more scalable and efficient AML compliance solutions.

The European Bank-as-a-Platform (BaaP) market is set to experience rapid growth, reaching a projected size of €7.5 billion by 2025. The market will grow at a CAGR of 22% between 2025 and 2030, driven by increased adoption of open banking, API monetization, and partner ecosystem collaboration.
Financial institutions are increasingly adopting BaaP models to enable collaboration with fintechs, create new business opportunities, and generate revenue through API monetization. By 2030, 30% of financial institutions in Europe will be operating on BaaP platforms, making this a major component of the future of banking in the region.
BaaP Market Growth Projection (2025-2030):

BaaP adoption in Europe is being driven by the increasing demand for seamless, open banking experiences that can connect customers with a variety of financial services. The market is expected to see a 30% reduction in compliance costs for financial institutions over the next five years, as BaaP solutions integrate regulatory compliance processes.
The key benefits of BaaP include enhanced collaboration with fintechs, streamlined API monetization, and the ability to offer new financial products and services at scale. As API platforms become more prevalent, the financial industry will be able to unlock new sources of revenue and customer engagement opportunities.
BaaP Adoption Rate in Europe (2025-2030):

Key trends driving the growth of BaaP in Europe include the growing adoption of open banking, the monetization of API ecosystems, and the increasing demand for collaborative partner networks. Financial institutions are embracing the BaaP model to foster innovation, reduce time to market, and enhance customer experiences.
The implementation of PSD2 in Europe is fueling the rise of BaaP, enabling secure third-party access to financial data and making it easier for banks to integrate new fintech partners and services. Furthermore, regulatory compliance is becoming easier with BaaP, as these platforms are equipped with built-in tools for managing compliance with evolving regulations such as GDPR and MiFID II.
BaaP models are most widely adopted by large financial institutions, which have the resources to implement and scale these platforms. However, smaller institutions are beginning to explore the benefits of BaaP and API monetization as well, though adoption rates are slower due to the complexity and initial costs.
In Europe, the key adopters of BaaP are banks that provide both retail and corporate services, insurance companies, and fintechs that specialize in payments and lending. These organizations are integrating BaaP into their operations to improve collaboration, enhance product offerings, and increase customer retention.
In Europe, the UK is the leading adopter of Bank-as-a-Platform models, due to the country’s advanced regulatory framework, robust fintech ecosystem, and digital-first banking infrastructure. Other countries, such as Germany, France, and the Netherlands, are also significant adopters, with increasing investments in BaaP platforms and API infrastructure.
The adoption rate in southern and eastern Europe is expected to rise significantly by 2030, as more institutions move towards digital transformation and open banking initiatives.
BaaP Adoption Across European Regions (2025):

The competitive landscape for BaaP in Europe is dominated by large financial institutions such as Barclays, HSBC, and BNP Paribas, which are leveraging their robust APIs and open banking frameworks to create new revenue opportunities and improve collaboration with fintechs. In addition, Visa, Mastercard, and other payment processors are investing heavily in BaaP technologies.Startups and challenger banks, such as Monzo and Revolut, are also making strides in BaaP, offering more agile and cost-effective solutions to their customers. These companies are driving innovation in the sector, making the BaaP space highly competitive.

Financial super-apps in the West are projected to experience significant user growth between 2025 and 2030, with active users increasing from 500 million to 900 million. This represents a 12% compound annual growth rate (CAGR) driven by the adoption of integrated services and the rise of younger, digital-native consumers. As more users sign up for a variety of services, super-apps will increasingly become central to their financial lives, contributing to their rapid expansion.

Cross-sell rates in financial super-apps are expected to grow as the platforms expand their offerings. Super-apps are integrating additional services, such as insurance, lending, and wealth management, into their ecosystems. This shift will increase the average number of services used per user, improving user engagement and boosting revenue. By 2030, the cross-sell rate is expected to rise from 2.5 to 4.2, driven by more personalized offerings and seamless user experiences.
The primary revenue drivers for financial super-apps include transaction fees, subscription models, embedded finance, and cross-selling additional financial products. As the ecosystem grows and diversifies, average revenue per user (ARPU) is expected to increase by 35%, from $45 in 2025 to $61 by 2030. The growth in ARPU will be largely attributed to higher user engagement and the adoption of new, high-margin services.
The regulatory landscape for super-apps is evolving in the West, with increased scrutiny on data privacy, financial services compliance, and user protection. While regulatory clarity helps establish trust, it also adds challenges in scaling services. The imposition of stricter rules may slow down innovation but is expected to bring long-term benefits as super-apps become more integrated into the financial system. Companies must adapt to new frameworks, especially for cross-border payments and lending.

Super-apps are increasingly cross-selling services like loans, insurance, savings accounts, and investment products to enhance customer loyalty and engagement. By offering a comprehensive suite of services, users become more entrenched in the ecosystem, increasing lifetime value (LTV). These offerings also help super-apps achieve higher cross-sell rates, which is projected to increase to 4.2 by 2030. The more services a user adopts, the less likely they are to leave, fostering higher retention rates.
As the market for super-apps becomes more competitive, the main risks include regulatory hurdles, customer acquisition costs, and the challenge of scaling new services while maintaining high-quality user experiences. Additionally, privacy concerns and cybersecurity threats could hinder growth. Super-apps must balance rapid expansion with sustainable profitability, especially as they enter saturated markets with established players.
Super-apps are outpacing traditional banks in terms of user engagement, as they provide seamless, integrated financial services that appeal to digitally-savvy consumers. Users of super-apps tend to interact with the app more frequently, using multiple services like payments, loans, savings, and investments. In comparison, traditional banks are still catching up in terms of product offerings, digital infrastructure, and user engagement, with many focusing on digitizing existing products
.

Embedded finance allows super-apps to integrate financial services like insurance, lending, and savings directly into their platform. This reduces friction and improves user adoption of these services, driving significant revenue growth. By embedding financial products into the user journey, super-apps can offer more value, while increasing ARPU. Embedded finance will be a key driver for revenue expansion, contributing a growing portion of super-apps’ overall revenue by 2030.
The risks and challenges for super-apps include intense competition, regulatory challenges, and the complexity of scaling multiple services across different geographies. Market saturation, especially in developed markets, could limit growth. Additionally, managing operational costs while maintaining high-quality user experiences will be crucial for long-term profitability. Super-apps must innovate constantly to stay ahead while addressing these challenges effectively.
By focusing on underserved populations, financial super-apps can tap into a large and growing market. Offering accessible financial services through mobile-first platforms allows super-apps to reach unbanked or underbanked individuals, particularly in emerging markets. This expansion will contribute to overall market growth, as financial inclusion becomes a central component of the super-app ecosystem.

• Rapid User Growth: Financial super-apps in the West are projected to see 12% CAGR in active users between 2025 and 2030.
• Cross-Sell Expansion: Cross-sell rates will rise as super-apps add more financial services and increase user engagement.
• Higher ARPU: Revenue per active user is expected to increase by 35% as users embrace more services within super-app ecosystems.
• Increased Market Share: Top players (e.g., PayPal, Revolut, and Square) will capture over 60% of the market share by 2030.
• Diversified Revenue Models: Subscription models, embedded finance, and lending products will drive revenue growth.

The comparative volume curve shows EU slightly ahead of the U.S. by 2030 in total merchant crypto GMV (illustrative $95B vs. $84B). Two forces explain the gap: (1) policy clarity under frameworks like MiCA enables PSPs to roll out crypto rails to a wider base of merchants; (2) consumer protections and harmonized disclosures encourage adoption beyond early adopters. In the U.S., growth concentrates where crypto beats cards on cost or conversion—especially in cross‑border retail and travel/leisure—while orchestration platforms stitch together compliance, tax, and treasury automation.
Share dynamics: large retailers and travel/leisure account for the majority of absolute volumes due to higher basket sizes and cross‑border corridors. Digital goods and marketplaces scale quickly from a smaller base, with creator‑economy integrations. No single PSP or wallet dominates; multi‑rail routing and vendor diversification are standard. By 2030, crypto is an optional rail in most enterprise stacks, activated when corridor economics guarantee contribution margin over card rails.

The cohort bar chart compares USA vs EU for 2025 and 2030. The EU shows broader dispersion across SMB retail and food delivery due to consumer protections and standardized disclosures, whereas the U.S. remains concentrated in higher‑ticket categories and cross‑border corridors. Digital goods and marketplaces benefit in both regions from push‑payment design and wallet SCA that reduce refund abuse and false declines.
Buying determinants are consistent across regions: (i) cost parity or improvement vs. cards (FX bypass, lower MDR, fewer chargebacks), (ii) conversion uplift via wallet SCA, (iii) operational automation (tax, AML/CFT, accounting, refund tooling), and (iv) reliable settlement SLAs and banking access. EU PSPs tend to compress fees earlier, while U.S. providers emphasize orchestration flexibility and corridor‑specific guarantees.

Within the United States, adoption is weighted to the West (~36%) and South (~31%)—reflecting tech concentration, cross‑border commerce intensity, and crypto‑native consumer segments. The Northeast (~19%) leads in enterprise experimentation and corporate treasury use cases; the Midwest (~14%) grows through PSP plugins and SMB commerce. EU‑U.S. comparative geography matters primarily in corridor planning: EU merchants rely on harmonized protections, whereas U.S. merchants depend on platform abstraction and corridor‑specific economics.
• Stablecoin resilience (reserves, attestation, banking) defines merchant confidence.
• Wallet‑native experiences (tokenized identity, SCA) improve auth and lower fraud.
• Multi‑rail checkout stacks become default; routing is governed by policy rules.
• EU’s harmonization accelerates mass‑market PSP offerings; U.S. remains platform‑driven.
• B2B cross‑border use cases lift average tickets and working‑capital benefits.
• Treasury automation (auto‑convert, ERP posting, reconciliation) converts pilots to BAU.
• Analytics instrumentation compares card vs. crypto funnels at SKU/category resolution.
• Vendor ecosystems consolidate around PSPs offering guarantees and compliance evidence.
• Large Retail: Negotiates fee floors and corridor guarantees; adopts wallet checkout; tests loyalty‑crypto blends.
• SMB Retail: Leans on PSP plugins to abstract compliance and tax; targets crypto‑native niches.
• Digital Goods/Marketplaces: Early adopters of push‑payments and escrow; reduce refund abuse.
• Travel/Leisure: Gains most from FX netting and faster settlement; high ticket sizes persist.
• Food Delivery/QSR: Small tickets but frequent; UX and loyalty tie‑ins drive adoption.
Enterprise success patterns: define corridor policies, instrument KPIs (auth, fraud, refunds, cost/tx), and automate treasury actions. EU firms scale broadly across tiers; U.S. firms scale where corridor economics are clearly superior to cards.
The competitive field spans (1) PSPs/orchestrators adding crypto rails; (2) stablecoin issuers and regulated on/off‑ramps; (3) wallets providing merchant‑grade SCA and tokenized identity; and (4) analytics/tax/reporting tools. Differentiation hinges on conversion uplift, fee transparency vs. cards, refund/escrow tooling, ERP automation, and compliance evidence. Expect consolidation around PSPs that deliver multi‑rail routing, corridor guarantees, and standardized audit packs. EU vendors gain speed from policy clarity; U.S. vendors win via flexible orchestration and SLA‑backed economics.