

68 Circular Road, #02-01 049422, Singapore
Revenue Tower, Scbd, Jakarta 12190, Indonesia
4th Floor, Pinnacle Business Park, Andheri East, Mumbai, 400093
Cinnabar Hills, Embassy Golf Links Business Park, Bengaluru, Karnataka 560071


Connect With Us


68 Circular Road, #02-01 049422, Singapore
Revenue Tower, Scbd, Jakarta 12190, Indonesia
4th Floor, Pinnacle Business Park, Andheri East, Mumbai, 400093
Cinnabar Hills, Embassy Golf Links Business Park, Bengaluru, Karnataka 560071
Connect With Us
68 Circular Road, #02-01 049422, Singapore
Revenue Tower, Scbd, Jakarta 12190, Indonesia
4th Floor, Pinnacle Business Park, Andheri East, Mumbai, 400093
Cinnabar Hills, Embassy Golf Links Business Park, Bengaluru, Karnataka 560071
Request Custom Transcript
5G Network Slicing for Industry 4.0: Customized SLAs & Manufacturing Use Cases
Network slicing enables 5G to provide production-grade connectivity for factories by offering deterministic performance (latency, jitter, uptime, isolation) per workload. US slicing and edge investments are expected to rise from ~$1.4B to ~$6.3B by 2030, with slice-enabled plants growing from ~250 to ~1,700. Key improvements include reduced latency (28ms to 8ms), lower jitter (12ms to 2ms), and increased availability (~99.95%). These enhancements lead to OEE gains (68% to 78%) and lower defect rates (950ppm to 420ppm). Pricing includes tiered SLAs and capacity-based terms for PLC/TSN. 5G slicing will drive Industry 4.0 connectivity, improving yield, throughput, and uptime.
What's Covered?
Report Summary
Key Takeaways
1. Deterministic SLAs (latency/jitter/uptime) unlock machine‑critical workloads.
2. Cataloged slice templates cut time‑to‑provision from days to hours.
3. Edge clustering + redundancy drives five‑9s availability for lines.
4. Machine‑vision and AGV slices lead revenue and ROI in US plants.
5. Zero‑trust segmentation and signed onboarding reduce lateral movement risk.
6. PLC/TSN integration needs bounded jitter (≤2ms) and clock sync.
7. KPIs to govern value: OEE, ppm defects, unplanned downtime, MTTR, IRR.
8. CFO view: SLA premiums tied to scrap avoided and throughput gains.

a) Market Size & Share
US spending on 5G network slicing and edge platforms for factories is modeled to grow from ~US$1.4B in 2025 to ~US$6.3B by 2030 as operators and enterprises standardize slice catalogs for machine‑vision, AGVs, AR, PLC/TSN, and IoT telemetry. Slice‑enabled plants scale from ~250 to ~1,700. The figure shows the capex/opex ramp and plant adoption. Share accrues to providers with reference designs, OT integrations, and proven jitter control.
Execution risks: integration debt across OT vendors, spectrum planning in reflective environments, and workforce upskilling. Mitigations: site surveys, pre‑certified RF designs, and co‑managed operations with strict change control. Share should be measured via slice revenue by use case, plants activated, and SLA attainment (latency/jitter/uptime).

b) Market Analysis
Performance translates to financial outcomes when slices are tied to production KPIs. We model latency (95p) improving from ~28ms to ~8ms, jitter from ~12ms to ~2ms, availability to ~99.95%, and time‑to‑provision from ~48 to ~1.5 hours. These drive OEE from ~68% to ~78% and defect rates from ~950ppm to ~420ppm by 2030, supporting IRR expansion from ~11% to ~19%. Enablers: edge clusters with HA, deterministic schedulers, TSN gateways, and policy‑based orchestration. Barriers: multi‑vendor OT stacks, RF reflections, and skills gaps.
Financial lens: quantify scrap avoided, throughput gain, and labor saved from remote ops; offset against slice fees, device certs, and managed services. The bar chart summarizes KPI improvements under disciplined slicing programs.

c) Trends & Insights
1) Catalog‑driven slicing with per‑use‑case blueprints becomes standard. 2) Bounded‑jitter PLC/TSN over 5G matures with tight clock sync. 3) Machine vision offload to edge GPUs reduces scrap and rework. 4) AGV/AMR fleets gain safety envelopes with low‑latency slices and positioning. 5) AR maintenance and digital work‑instructions cut MTTR and training time. 6) Zero‑trust for OT: signed device onboarding, micro‑segmentation, and SBOMs. 7) Unit‑economics dashboards tie SLA tiers to OEE and ppm. 8) Multi‑band spectrum strategies blend CBRS, C‑band, and mmWave for coverage vs capacity. 9) Vendor ecosystems shift to open APIs and portable slice descriptors. 10) Green ops: energy‑aware scheduling and sleep modes on idle shifts.
d) Segment Analysis
Automotive: machine‑vision QA and AGVs dominate; mmWave hotspots for paint/body lines. Electronics: high mix/low volume; AR maintenance and QA are key. Food & Beverage: hygiene‑safe mobility and dense IoT; prioritize uptime and traceability. Heavy Industry: PLC/TSN with strict jitter and ruggedized devices. Pharma: compliance logging and environmental control slices. Across segments, define use‑case SLAs, spectrum plans, and integration with MES/PLC; track OEE, defects ppm, unplanned downtime, MTTR, and IRR by line.
e) Geography Analysis
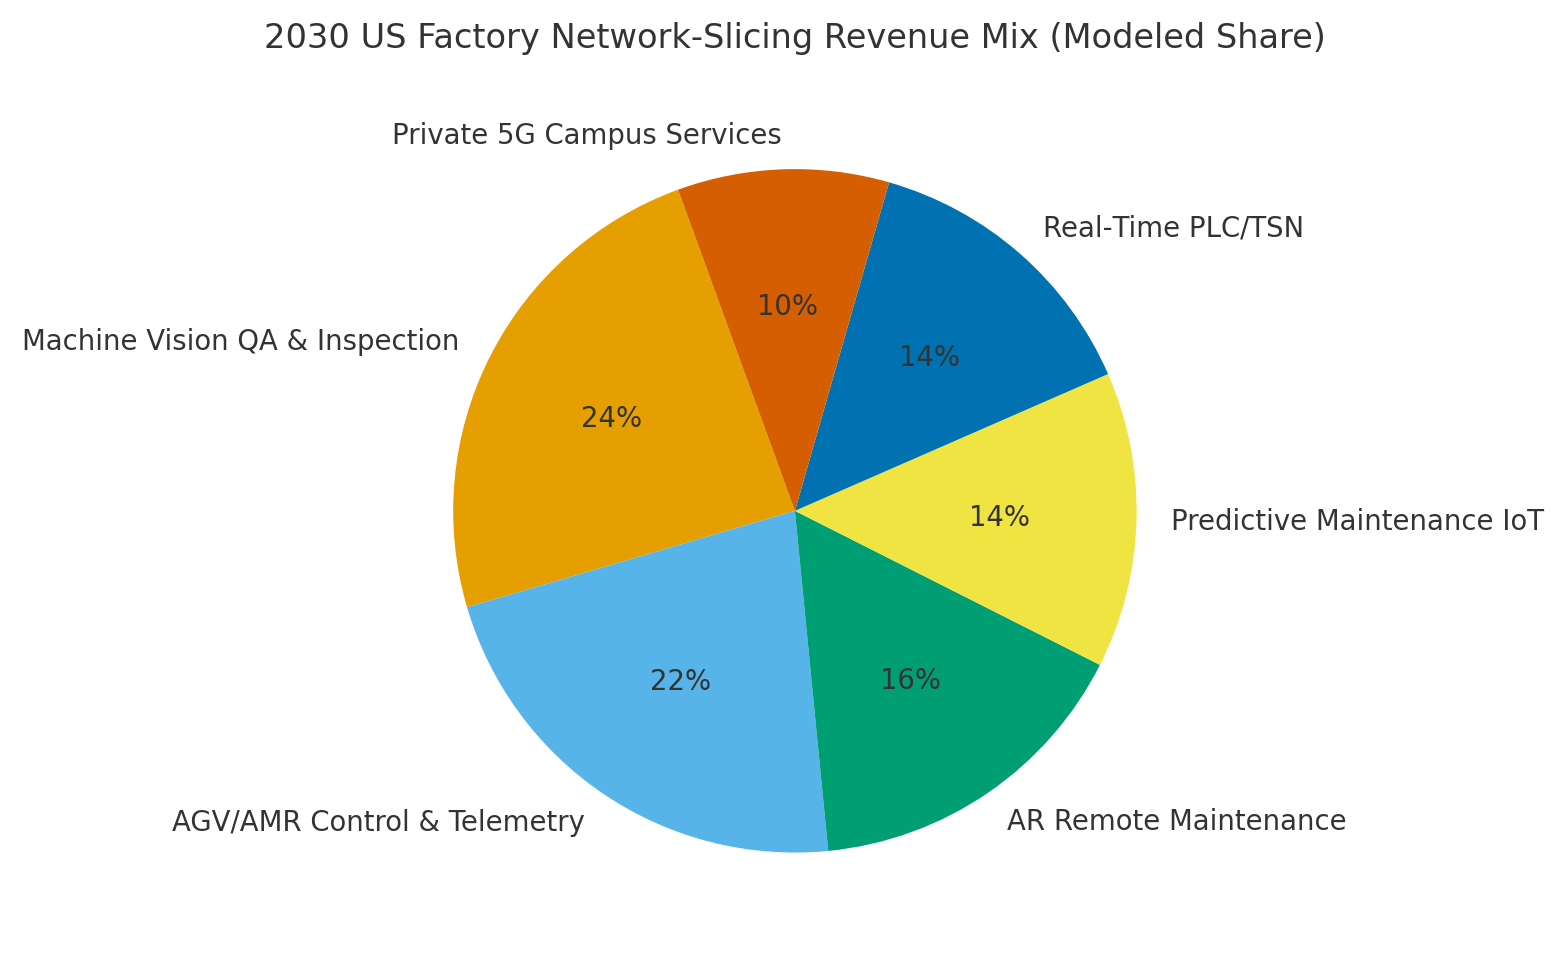
By 2030, we model US factory slicing revenue/use‑case mix as Machine Vision QA (~24%), AGV/AMR (~22%), AR Maintenance (~16%), Predictive IoT (~14%), Real‑Time PLC/TSN (~14%), and Private 5G Campus Services (~10%). Midwest and South lead due to automotive and electronics corridors; West adds high‑tech fabs; Northeast grows in pharma and specialty manufacturing. The pie figure reflects the mix.
Execution: phase rollouts by corridor density and partner ecosystems; align with spectrum availability (CBRS vs licensed); and stand up co‑managed ops. Measure region‑specific OEE lift, defect reduction, downtime cuts, and SLA attainment; rebalance capex quarterly.
f) Competitive Landscape
Operators, neutral‑host providers, hyperscalers, and OT vendors compete to own the industrial slice stack. Differentiation vectors: (1) deterministic performance (latency/jitter/uptime) proven on real lines, (2) TSN/PLC integration and certification, (3) automation depth from catalog to day‑2 ops, (4) security posture (zero‑trust, SBOMs, attestation), and (5) economics and co‑managed support. Procurement guidance: require SLA‑backed jitter bounds, failover and maintenance windows, open APIs, and observability that correlates slices to OEE/ppm. Competitive KPIs: latency, jitter, availability, time‑to‑provision, OEE lift, defect reduction, downtime, and IRR.
Report Details
Proceed To Buy
Want a More Customized Experience?
- Request a Customized Transcript: Submit your own questions or specify changes. We’ll conduct a new call with the industry expert, covering both the original and your additional questions. You’ll receive an updated report for a small fee over the standard price.
- Request a Direct Call with the Expert: If you prefer a live conversation, we can facilitate a call between you and the expert. After the call, you’ll get the full recording, a verbatim transcript, and continued platform access to query the content and more.
68 Circular Road, #02-01 049422, Singapore
Revenue Tower, Scbd, Jakarta 12190, Indonesia
4th Floor, Pinnacle Business Park, Andheri East, Mumbai, 400093
Cinnabar Hills, Embassy Golf Links Business Park, Bengaluru, Karnataka 560071
Request Custom Transcript
Related Transcripts

$ 1350

68 Circular Road, #02-01 049422, Singapore
Revenue Tower, Scbd, No.52-53, Jakarta 12190, Indonesia
Cinnabar Hills, Embassy Golf Links Business Park, Bengaluru, Karnataka 560071
4th Floor, Pinnacle Business Park, Andheri East, Mumbai, 400093


68 Circular Road, #02-01 049422, Singapore
Revenue Tower, Scbd, Jakarta 12190, Indonesia
4th Floor, Pinnacle Business Park, Andheri East, Mumbai, 400093
Cinnabar Hills, Embassy Golf Links Business Park, Bengaluru, Karnataka 560071